 Stay
Stay 
Trading Conditions
Products
Tools


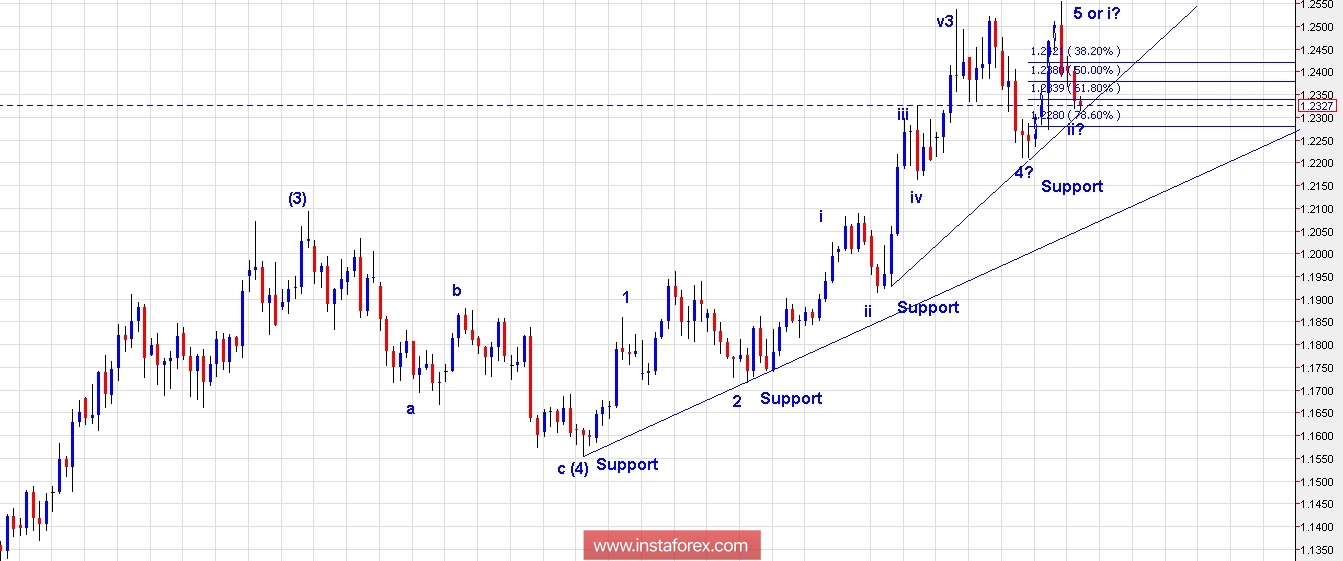
Technical outlook:
A daily chart view wave count has been presented here with a focus on the (5)th wave labeling. As seen here, the pair seems to be unfolding into its 5th wave, within the (5)th wave. The rally between 1.2205 through 1.2550 levels can be either termed as 5th wave termination or wave i. Keeping this in mind, the drop through 1.2215 levels can be termed as wave ii and if the above count holds true, waves iii, iv and v shall be seen on the north side. Prices should remain above 1.2205 levels for the above count to hold true. These are final stages of the rally that began from January 2017 and a meaningful correction can be expected after major top forms around 1.2700 levels going forward. You can view the educational video on my channel. On the flip side, a break below 1.2205 from here would confirm that a meaningful top is already in place and that the pair has reversed lower already.
Trading plan:
Selling on rallies through 1.2600/1.2700 levels is favored.
US Dollar Index chart setups:
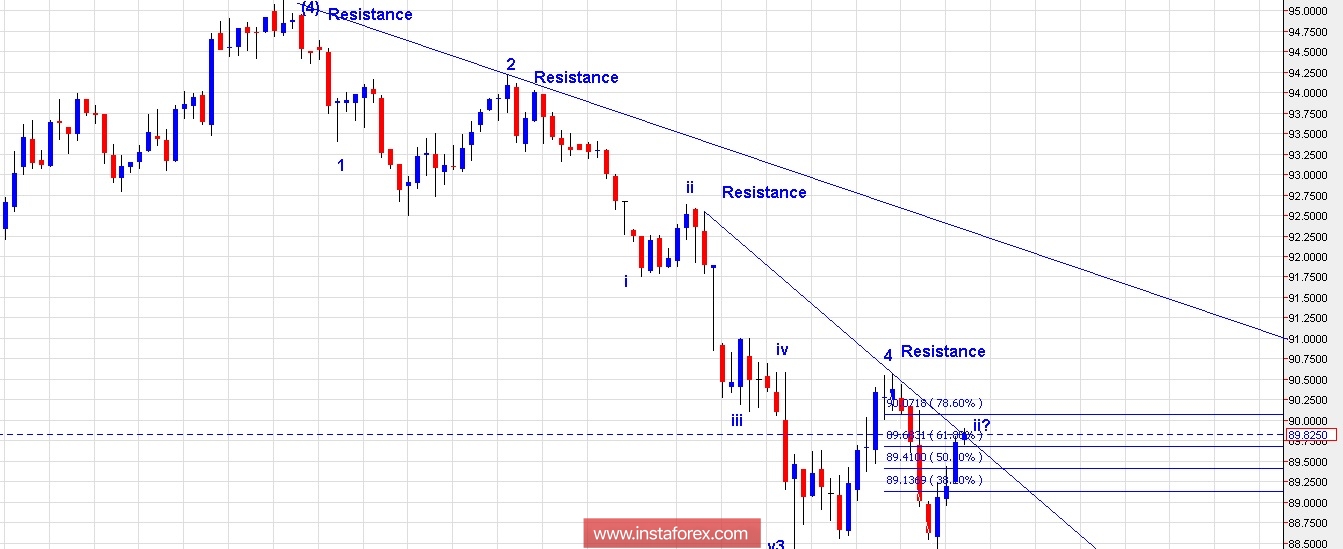
Technical outlook:
A daily chart view has been presented here with labeled wave counts since wave (4) termination point. As depicted here, looks like the US Dollar Index is on its last leg lower towards 86.00 levels before turning higher again. The entire drop from January 2017 103.80 levels is coming to an end with the 5th of 5th wave underway lower. The drop between 90.60 through 88.20 levels can be labeled as wave 5 or i as shown here. Hence the subsequent rally can be defined as wave ii; and if this count holds turn the next push should be lower to produce waves iii, iv and v respectively. For this count to hold, prices should remain below 90.60 levels going forward. On the flip side, a break above 90/60 levels would indicate that a meaningful bottom is already in place and that the pair should be heading higher in a meaningful manner.
Trading plan:
Looking to buy on dips through 86.00/87.00 levels is favored.
Fundamental outlook:
No major fundamental event lined up for today.
Good luck!
InstaForex analytical reviews will make you fully aware of market trends! Being an InstaForex client, you are provided with a large number of free services for efficient trading.


