 Stay
Stay 
Trading Conditions
Products
Tools

The pair remains well consolidated above the 200 SMA at the H1 chart, where it found support during March 27th session. Such area helped to give a boost to the Cable in the short-term and we can expect further rallies toward the resistance zone of 1.4225. To the downside, if GBP/USD manages to break below the moving average, then it can go to test the March 20th lows.
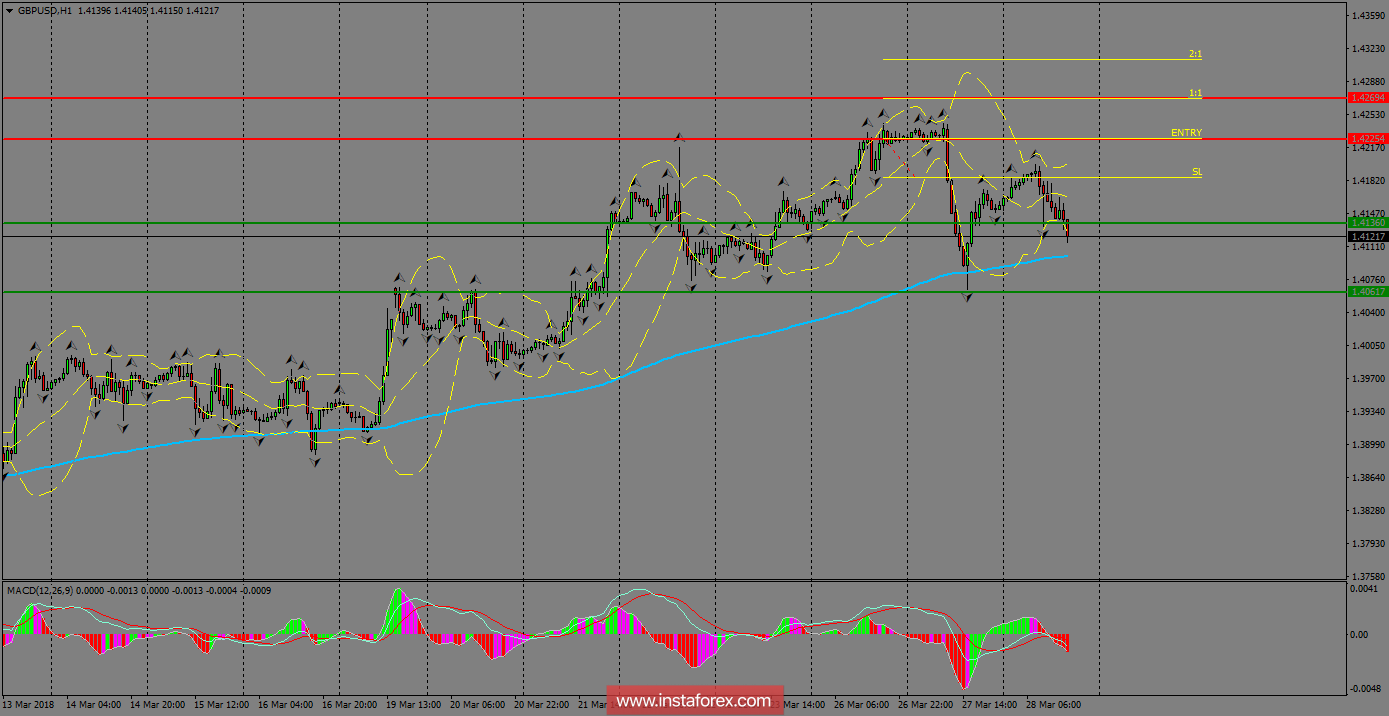
H1 chart's resistance levels: 1.4225 / 1.4269
H1 chart's support levels: 1.4136 / 1.4061
Trading recommendations for today: Based on the H1 chart, buy (long) orders only if the GBP/USD pair breaks a bullish candlestick; the resistance level is at 1.4225, take profit is at 1.4269 and stop loss is at 1.4185.InstaForex analytical reviews will make you fully aware of market trends! Being an InstaForex client, you are provided with a large number of free services for efficient trading.


