 Stay
Stay 
Trading Conditions
Products
Tools


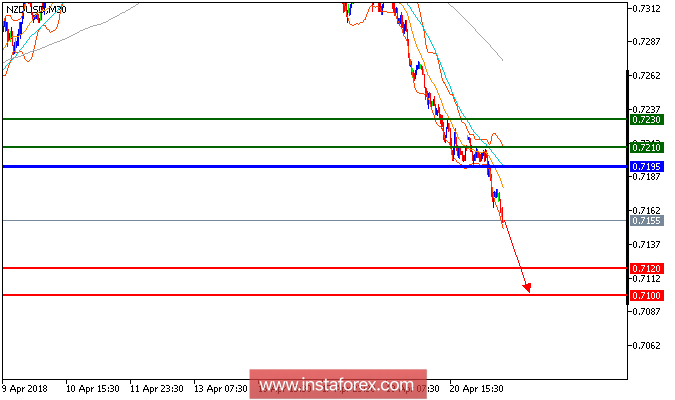
All our targets which we predicted in yesterday's analysis have been hit, NZD/USD is still under pressure and expected to continue its downside movement. The pair is holding on the downside and is trading below its declining 20-period and 50-period moving averages, which play resistance roles and maintain the downside bias. The relative strength index below its neutrality level at 50. Hence, as long as 0.7195 is not surpassed, look for a drop with targets at 0.7120 and 0.7100 in extension.
Chart Explanation: The black line shows the pivot point. Currently, the price is above the pivot point, which is a signal for long positions. If it remains below the pivot point, it will indicate short positions. The red lines show the support levels, while the green line indicates the resistance levels. These levels can be used to enter and exit trades.
Resistance levels: 0.7210, 0.7230, and 0.7275
Support levels: 0.7120, 0.7100, and 0.7060.
InstaForex analytical reviews will make you fully aware of market trends! Being an InstaForex client, you are provided with a large number of free services for efficient trading.

