 Stay
Stay 
Trading Conditions
Products
Tools

The index is forming a higher high pattern above the 90.63 level, which is now acting as a support. The focus is now placed on the 91.75 level, where the bulls could gather momentum in order to extend the bias for the short-term. However, a breakout below 90.63 should expose the 200 SMA at H1 chart. MACD indicator is favoring the bearish bias, as it stays in the negative territory.
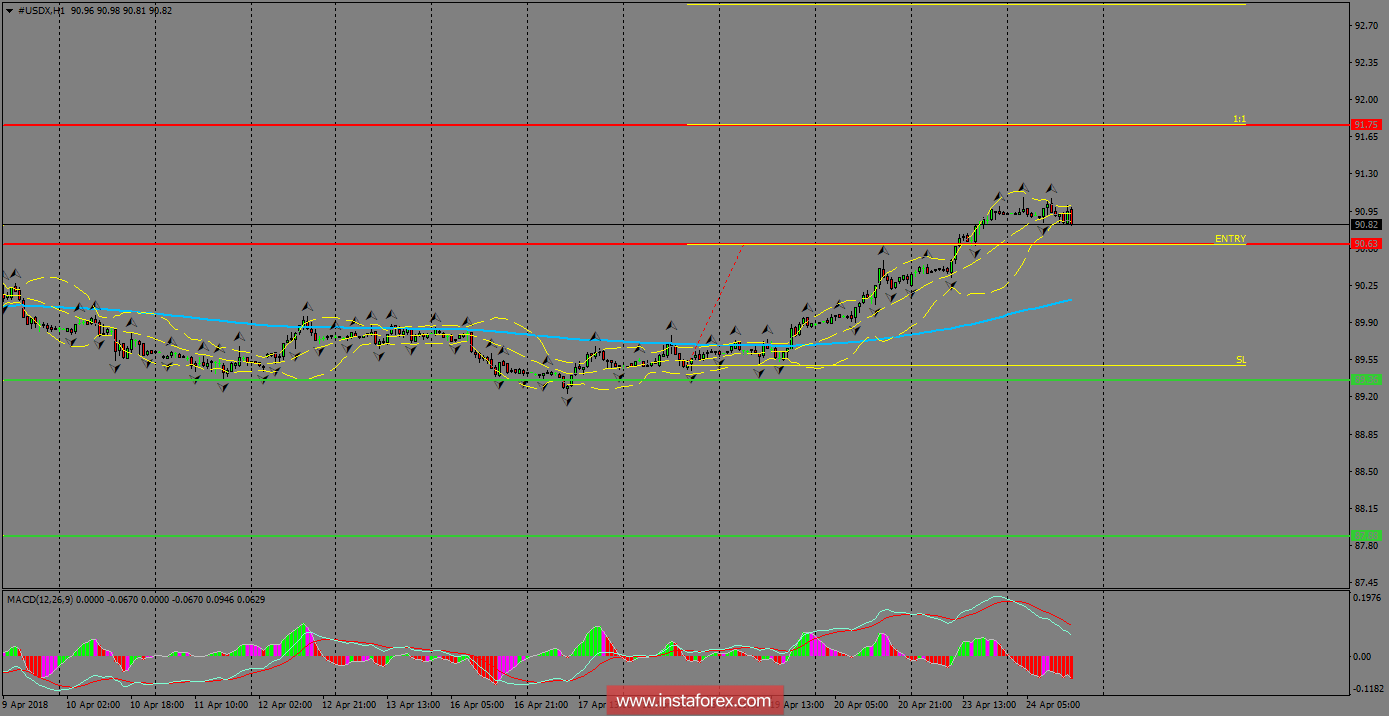
H1 chart's resistance levels: 90.63 / 91.75
H1 chart's support levels: 89.36 / 87.88
Trading recommendations for today: Based on the H1 chart, place buy (long) orders only if the USD Index breaks with a bearish candlestick; the support level is at 90.63, take profit is at 91.75 and stop loss is at 89.49.InstaForex analytical reviews will make you fully aware of market trends! Being an InstaForex client, you are provided with a large number of free services for efficient trading.


