 Stay
Stay 
Trading Conditions
Products
Tools


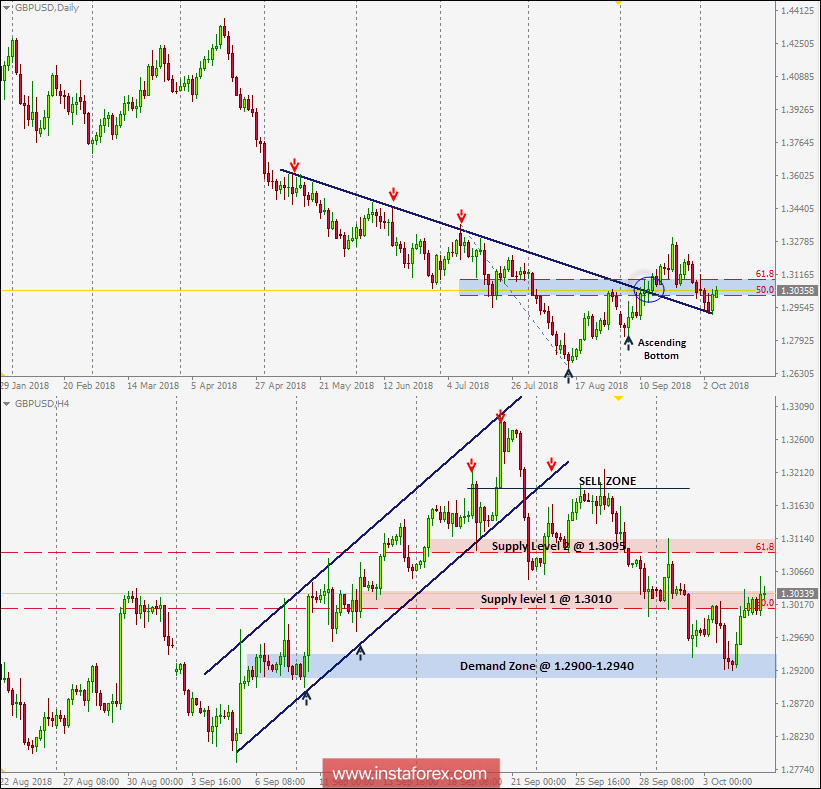
On September 13, the depicted daily downtrend line which came to meet the pair around 1.3025-1.3090 failed to offer enough bearish pressure on the pair. Since then, the GBP/USD pair has been demonstrating a successful bullish breakout so far.
However, On H4 chart, the market failed to maintain its uptrend within the depicted bullish channel on H4 chart. The lower limit of the depicted channel (which came to meet the GBP/USD pair around 1.3190) failed to offer sufficient bullish demand.
Therefore, the GBP/USD short-term outlook turned to become bearish towards 1.3010 (50% Fibonacci level) and 1.2940 (recent demand level).
Moreover, the price level of 1.3190 (the backside of the broken bullish channel) offered significant bearish rejection which initiated the recent bearish decline towards 1.2940.
Recently, the price level of 1.2900-1.2940 (the backside of the broken uptrend) is demonstrating significant bullish recovery where the current bullish movement was initiated.
On the other hand, regarding the price levels (1.3010-1.3090) corresponding to 50% and 61.8% Fibonacci levels. Currently, these price levels turned to become supply levels to be watched for bearish price action on retesting.
The current bearish decline below 1.3010 (50% Fibo level) should be defended to pursue towards lower bearish targets(1.2900-1.2940). Otherwise, further bullish advancement towards 1.3090 (61.8% Fibo) would be expected.
InstaForex analytical reviews will make you fully aware of market trends! Being an InstaForex client, you are provided with a large number of free services for efficient trading.

