 Stay
Stay 
Trading Conditions
Products
Tools


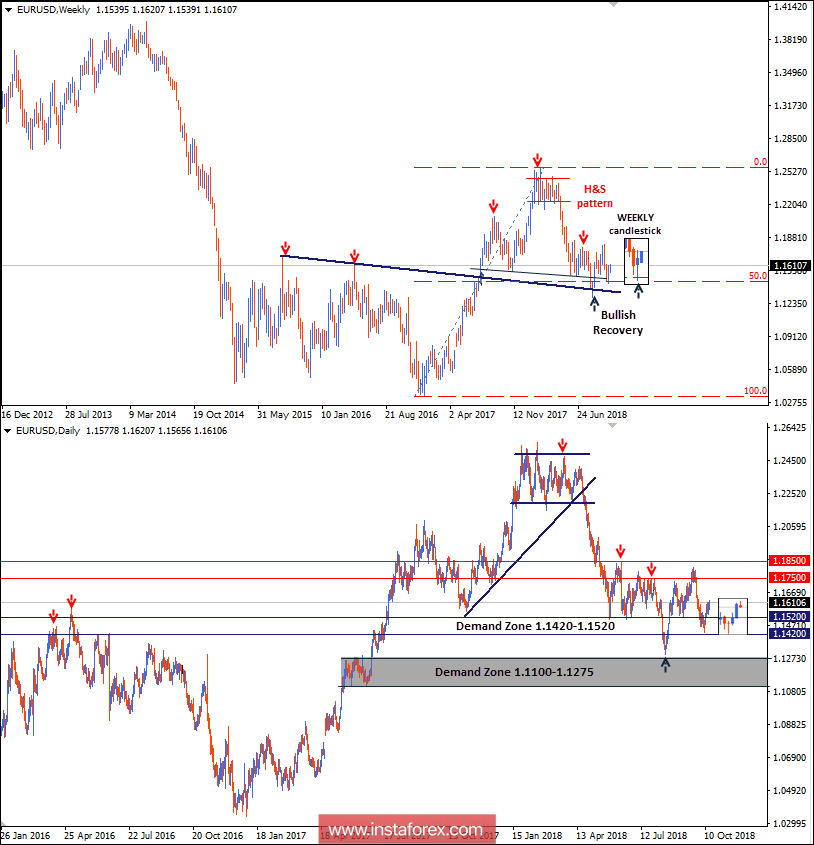
On the weekly chart, the EUR/USD pair is demonstrating a high-probability Head and Shoulders reversal pattern where the right shoulder is currently in progress.
On September 10, the price level of 1.1500 offered temporary bullish recovery. A quick bullish movement was demonstrated towards the upper limit of the price range (1.1750). However, the EUR/USD bulls failed to pursue towards higher bullish targets.
Instead, evident bearish momentum was being demonstrated on the daily chart. On October 10, a recent decline below 1.1520 found its way towards the price level of 1.1420.
As for the bearish side of the market to remain dominant, the EUR/USD pair should keep trading below the price level of 1.1520.
However, last week, evident signs of bullish recovery were demonstrated around 1.1430 (Note the full-bullish candlestick of Thursday). This brings the EUR/USD pair again above 1.1520.
Hence, the EUR/USD pair resumes its sideway consolidations inside the depicted consolidation range (1.1520-1.1750) until a bearish breakout occurs later.
The nearest supply level to be visited is located around 1.1670 (a potential bullish target).
InstaForex analytical reviews will make you fully aware of market trends! Being an InstaForex client, you are provided with a large number of free services for efficient trading.

