 Stay
Stay 
Trading Conditions
Products
Tools


Gold price is trading around $1,224 remaining in a bullish short-term trend. Price is now above the 61.8% Fibonacci retracement but the upward momentum has weakened according to the 4hour RSI. I expect Gold to pull back or start a new downward move from current levels.
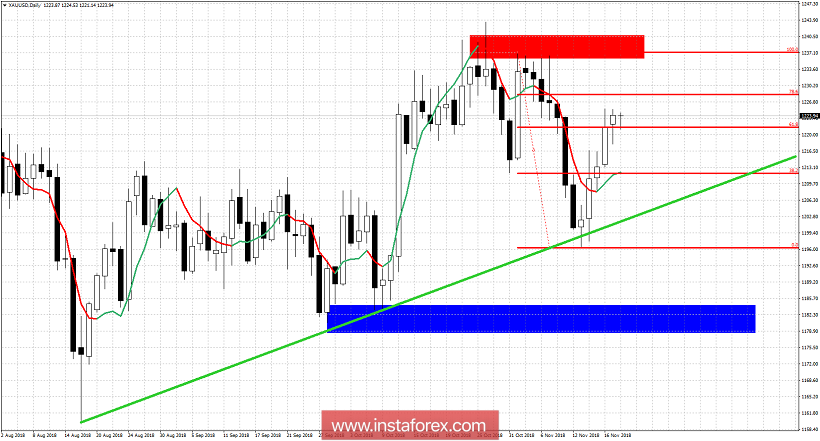
Blue rectangle - major support
Green trend line - short-term trend support
Gold price is making higher highs and higher lows in small time frames. However in the Daily chart we remain below the key resistance of $1,243.50. Gold price shows bearish divergence RSI signs in the 4 hour chart and if short-term support at $1,218 is broken, I will assume that the entire bounce is over and we should at least challenge the green trend line at $1,210-$1,205 area. Gold price has important support at $1,196 that if broken, we will see prices move towards the blue rectangle area at least. If the red rectangle resistance is broken Gold could rally 20$ higher. I continue to consider this bounce as a selling opportunity with stops at the highs of October and remain bearish as long as we trade below that area.
InstaForex analytical reviews will make you fully aware of market trends! Being an InstaForex client, you are provided with a large number of free services for efficient trading.


