 Stay
Stay 
Trading Conditions
Products
Tools


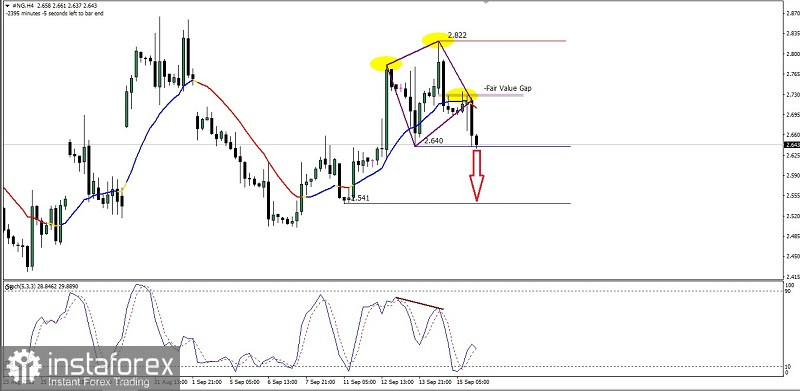
Apart from the appearance of deviations between price movements and the Stochastic Oscillator indicator as well as the price movement is below the WMA (20) which also has a decreasing slope, this all indicates that in the future Natural Gas on the 4-hour chart has the potential to weaken, which is also confirmed by the appearance of the Bearish Diamond pattern (maroon diamond) / Head & Shoulder (yellow circle) which is a Bearish Reversal pattern so that in the near future #NG has the potential to test level 2,640 if this level is successfully broken downwards and during the downward journey there is no upward retrace that exceeds level 2,790 then #NG has the opportunity to continue its weakening in the near future to the level of 2,541.
(Disclaimer)
InstaForex analytical reviews will make you fully aware of market trends! Being an InstaForex client, you are provided with a large number of free services for efficient trading.

