 Stay
Stay 
Trading Conditions
Products
Tools


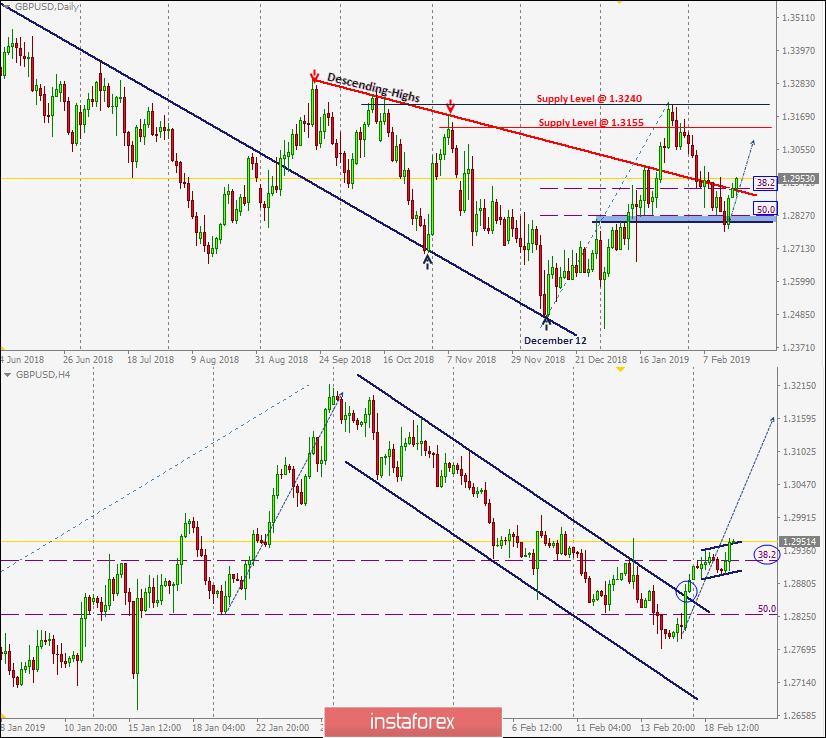
On December 12, the previously-dominating bearish momentum came to an end when the GBP/USD pair visited the price levels of 1.2500 where the backside of the broken daily uptrend was located.
Since then, the current bullish swing has been taking place until January 28 when the GBP/USD pair was almost approaching the supply level of 1.3240 where the recent bearish pullback was initiated.
Shortly after, the GBP/USD pair lost its bullish persistence above 1.3155.
Hence, the short-term scenario turned bearish towards 1.2920 (38.2% Fibonacci) then 1.2820-1.2800 where (50% Fibonacci level) as well as a previous prominent top are located (Highlighted in BLUE).
Last week, lack of bullish demand was demonstrated around 1.2920 until Friday when significant bullish recovery was demonstrated around 1.2800-1.2820 (Fibonacci 50% level) resulting in a Bullish Engulfing daily candlestick.
This led to the current bullish breakout above the depicted H4 bearish channel. Expected bullish targets are projected towards 1.2970, 1.3040 and 1.3200.
Bullish persistence above 1.2920 (38.2% Fibonacci) is mandatory so that the current bullish movement can pursue towards the mentioned bullish targets.
InstaForex analytical reviews will make you fully aware of market trends! Being an InstaForex client, you are provided with a large number of free services for efficient trading.


