 Stay
Stay 
Trading Conditions
Products
Tools


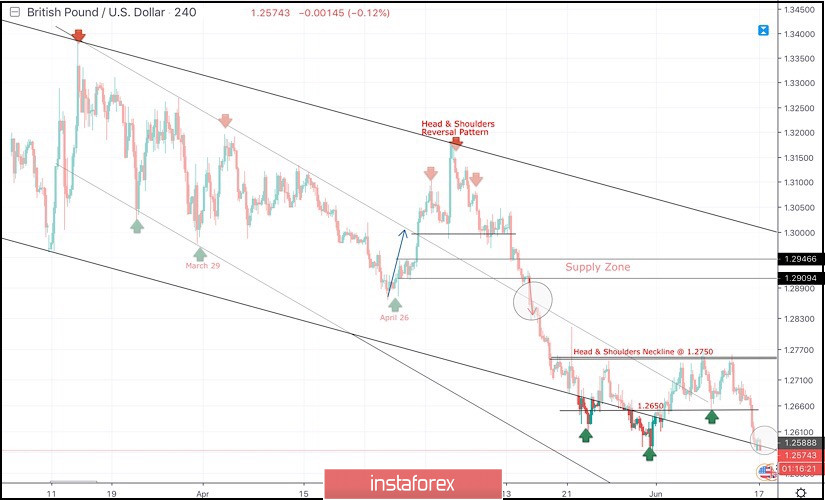
On March 29, a visit towards the price levels of 1.2980 (the lower limit of the newly-established bearish movement channel) could bring the GBPUSD pair again towards the upper limit of the minor bearish channel around (1.3160-1.3180).
Since then, Short-term outlook has turned into bearish with intermediate-term bearish targets projected towards 1.2900 and 1.2850.
On April 26, another bullish pullback was initiated towards the price zone of 1.3130-1.3170 where the depicted bearish Head and Shoulders reversal pattern was demonstrated on the H4 chart with neckline located around 1.2980-1.3020.
Hence, Bearish breakdown below 1.2980 allowed the recent significant bearish movement to occur.
Initial bearish Targets were already reached around 1.2900-1.2870 (the backside of the broken channel) followed by further bearish decline towards the lower limit of the long-term channel around (1.2700-1.2650) where the GBPUSD pair looked oversold.
Shortly after, bullish breakout above 1.2650 was achieved. This enhanced the bullish side of the market towards 1.2750 which prevented further bullish advancement few times so far.
Recently, the price level of 1.2650 stood as a temporary demand level (corresponding to the right shoulder of a bullish Head & Shoulders reversal pattern).
For the bulls to regain dominance, another bullish breakout above 1.2750 (neckline) was needed to extend potential bullish targets towards 1.2800, 1.2890 and 1.2940.
However, recent bearish decline below 1.2600 was demonstrated on Friday thus invalidating the mentioned bullish scenario for the short-term.
As long as bearish persistence below 1.2650 is maintained on H4 chart, further bearish decline should be expected towards 1.2535 then 1.2485.
Trade Recommendations:
Conservative traders should wait for a valid BUY entry upon bullish breakout above 1.2750. T/P levels to be located around 1.2820, 1.2900 and 1.2940. S/L should be placed below 1.2690.
SELL positions shouldn't be considered at such low price levels unless bearish breakout below 1.2570 becomes confirmed on higher timeframes (daily chart).
InstaForex analytical reviews will make you fully aware of market trends! Being an InstaForex client, you are provided with a large number of free services for efficient trading.

