 Stay
Stay 
Trading Conditions
Products
Tools

In a previous analysis back in August 20th we mentioned that we expect price to eventually break the resistance area around 98 and move towards 99-99.20 level. Today's high is at 99.07 and the weekly RSI continues to diverge.
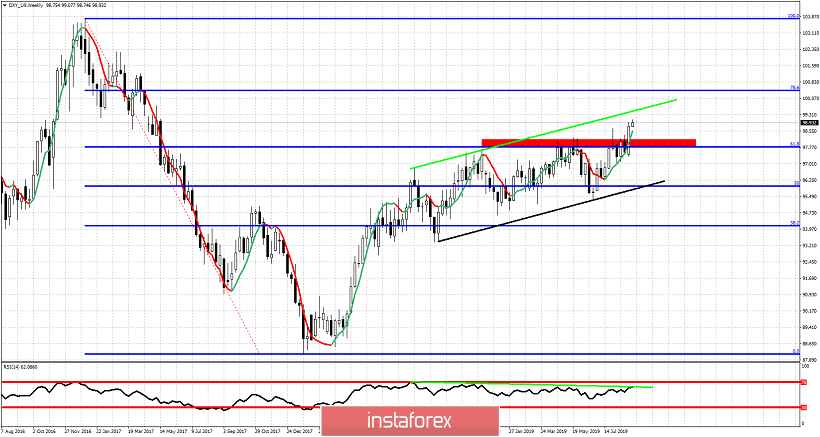
Black line - major support trend line
Red rectangle - resistance (broken)
The Dollar index has broken above a multi month resistance area where prices got rejected several times. This time the break is real and prices move towards 99 as expected. Trend remains bullish and the break above the 61.8% Fibonacci retracement is a big win for bulls. As long as price is above 98-97.70 bulls remain in control of the trend. The weekly RSI is testing important resistance area. The RSI does not confirm the new high by price. Traders should not ignore this bearish divergence. This is not a reversal signal but only a warning.
InstaForex analytical reviews will make you fully aware of market trends! Being an InstaForex client, you are provided with a large number of free services for efficient trading.


