empty
 
 
You are about to leave
www.instaforex.eu >
a website operated by
INSTANT TRADING EU LTD
Open Account

08.10.201908:11 Forex Analysis & Reviews: Gold price forms a short-term bearish channel

This information is provided to retail and professional clients as part of marketing communication. It does not contain and should not be construed as containing investment advice or investment recommendation or an offer or solicitation to engage in any transaction or strategy in financial instruments. Past performance is not a guarantee or prediction of future performance. Instant Trading EU Ltd. makes no representation and assumes no liability as to the accuracy or completeness of the information provided, or any loss arising from any investment based on analysis, forecast or other information provided by an employee of the Company or otherwise. Full disclaimer is available here.

Gold price is trading below $1,500 again and as explained in our previous analysis, Gold has the potential to move towards $1,450-$1,400 area as long as price is below $1,535. Short-

term trend is bearish and the weekly indicators show that there are many chances of an important top.

Exchange Rates 08.10.2019 analysis

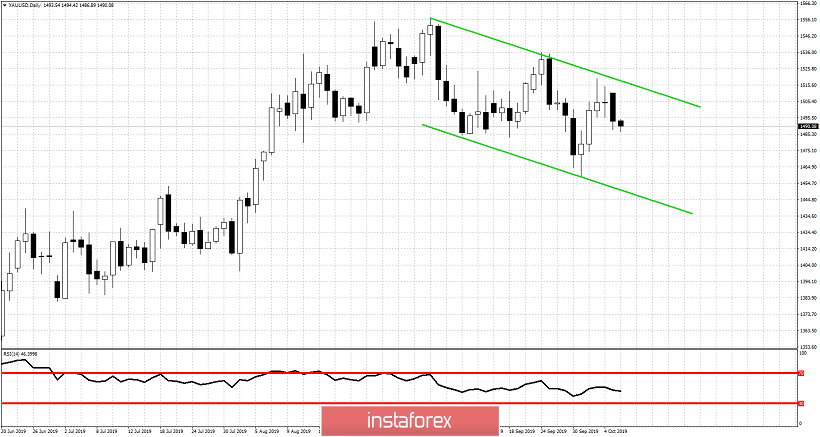
Green lines - bearish channel

Gold price was unable to break above the $1,535 resistance and made a lower high at $1,520. Price has stopped at the upper channel boundary and is reversing. Bears are looking for a pull back at least towards the lower channel boundary. On the other hand bulls want to see price break above $1,520. As long as price is below $1,520-$1,535 resistance area bears are in control of the trend. A break below $1,460 will be another bearish sign that would imply a move towards $1,400 is very possible.

Exchange Rates 08.10.2019 analysis

On a daily basis according to the Ichimoku cloud indicator we have a trend change to neutral as price has entered into the cloud. Price also got rejected at the tenkan- and kijun-sen (red and green lines) indicators and this is another bearish warning. Inability to break above the two indicators is a sign of weakness. Support is at the lower cloud boundary at $1,469 and a break below it will be a bearish sign. The view we have from the Ichimoku cloud indicator is not bullish but bears need some confirmation before they get control of the Daily trend.
Alexandros Yfantis
Analytical expert of InstaForex
© 2007-2024

Open trading account

InstaForex analytical reviews will make you fully aware of market trends! Being an InstaForex client, you are provided with a large number of free services for efficient trading.


You are now leaving www.instaforex.eu, a website operated by INSTANT TRADING EU LTD
Can't speak right now?
Ask your question in the chat.

Turn "Do Not Track" off