empty
 
 
You are about to leave
www.instaforex.eu >
a website operated by
INSTANT TRADING EU LTD
Open Account

13.10.201910:11 Forex Analysis & Reviews: Weekly analysis of Gold

Long-term review
This information is provided to retail and professional clients as part of marketing communication. It does not contain and should not be construed as containing investment advice or investment recommendation or an offer or solicitation to engage in any transaction or strategy in financial instruments. Past performance is not a guarantee or prediction of future performance. Instant Trading EU Ltd. makes no representation and assumes no liability as to the accuracy or completeness of the information provided, or any loss arising from any investment based on analysis, forecast or other information provided by an employee of the Company or otherwise. Full disclaimer is available here.

Gold price started the week higher than the previous week close but ended with a lower close. Bulls have failed to hold above the $1,500 pivot level and price remains inside the bearish channel showing more signs of weakness.

Exchange Rates 13.10.2019 analysis

Green lines - bearish channel

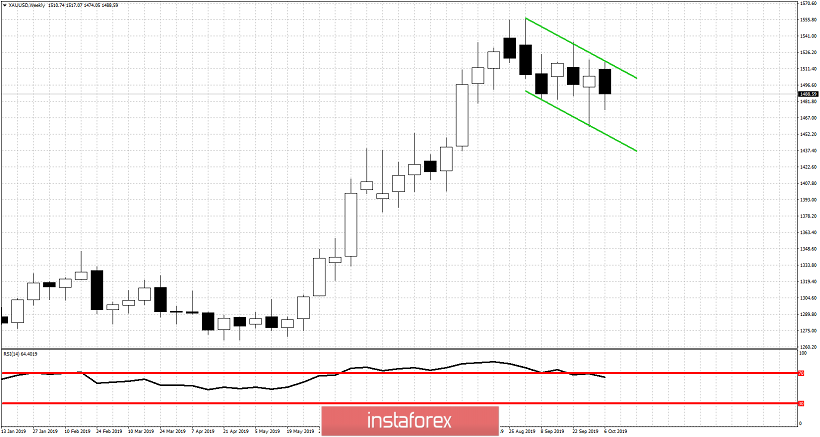
Gold price is still inside the weekly bearish channel while the RSI is turning lower from overbought levels breaking below 70. This implies more downside should be expected. Our key resistance level of $1,525-35 remains intact and as long as price respects this resistance we remain bearish and consider each bounce as a selling opportunity. Our expectations remain bearish targeting a move below $1,460.

Exchange Rates 13.10.2019 analysis

According to the Daily Ichimoku cloud indicator we have more bearish signs than bullish ones. Price is making lower lows and lower highs. Price has entered inside the Kumo (cloud) turning trend to neutral. A break below the lower cloud boundary will turn trend to bearish. However we have some bearish signals before price breaks below the cloud. Price has broken below both the tenkan- sen and the kijun-sen, unable to stay above them despite the recent bounce. The Chikou span (green line indicator) is below Price signifying short-term trend is bearish. All the above change on a break above $1,525-35 resistance area. Until then we remain bearish.
Alexandros Yfantis
Analytical expert of InstaForex
© 2007-2024

Open trading account

InstaForex analytical reviews will make you fully aware of market trends! Being an InstaForex client, you are provided with a large number of free services for efficient trading.


You are now leaving www.instaforex.eu, a website operated by INSTANT TRADING EU LTD
Can't speak right now?
Ask your question in the chat.

Turn "Do Not Track" off