 Stay
Stay 
Trading Conditions
Products
Tools


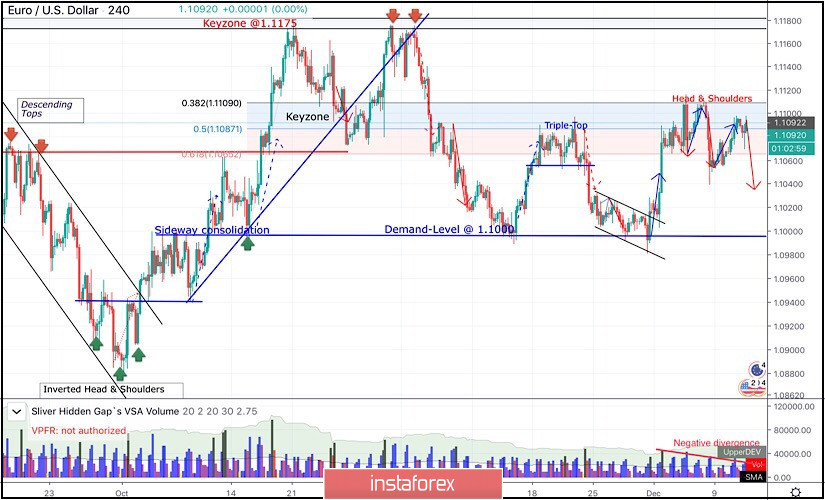
Since October 2, the EURUSD pair has been trending-up until October 21 when the pair hit the price level of 1.1175.
The price zone of (1.1175 - 1.1190) stood as a significant SUPPLY-Zone that demonstrated bearish rejection for two consecutive times in a short-period.
Hence, a long-term Double-Top pattern was demonstrated with neckline located around 1.1075-1.1090 offering valid bearish positions few weeks ago.
Shortly After, two consecutive bearish movements were executed towards 1.1000-1.0995 where another two episodes of bullish rejection were demonstrated.
That's why, the price zone of 1.1065-1.1085 where a cluster of supply levels were located (61.8% Fibo - 50% Fibo levels) prevented further bullish advancement.
Thus, the EUR/USD Pair has been trapped between the price levels of 1.1000 and 1.1085 (where a cluster of supply levels is located) until Wednesday when a bullish spike was demonstrated above 1.1085 (towards 1.1110).
Initial bearish rejection was anticipated around 1.1110 to bring bearish decline towards 1.1065.
Earlier this week, recent signs of bullish recovery were manifested around 1.1040 allowing the current bullish pullback to occur towards 1.1085 while demonstrating bearish divergence as depicted on the H4 chart.
Moreover, atypical Head & Shoulders reversal pattern is being demonstrated with neckline located around 1.1065.
That's why, bearish persistence below 1.1065 is needed to validate this reversal pattern. Bearish projection target to be located around 1.1010.
Trade recommendations :
The current bullish pullback towards the price zone around (1.1085) should be considered for a valid SELL entry.
Initial T/P levels to be projected towards 1.1045 and 1.1000, while S/L should be placed above 1.1115.
Any bullish breakout above 1.1110 invalidates this bearish scenario allowing further bullish advancement to occur towards 1.1140 and 1.1175.
InstaForex analytical reviews will make you fully aware of market trends! Being an InstaForex client, you are provided with a large number of free services for efficient trading.

