 Stay
Stay 
Trading Conditions
Products
Tools


USD/JPY Chart. Yesterday's Summary
Bears have shown some strength yesterday, but it was not enough to push the price down to 107.939. The only bear candle that had been formed was a candle that is caused by buyers by taking some money out from the market.
The first support at 108.717 was too strong for bears. That level did not allow the price to move down because buyers were waiting to enter and continue pushing the price higher.
Outlook for USD/JPY
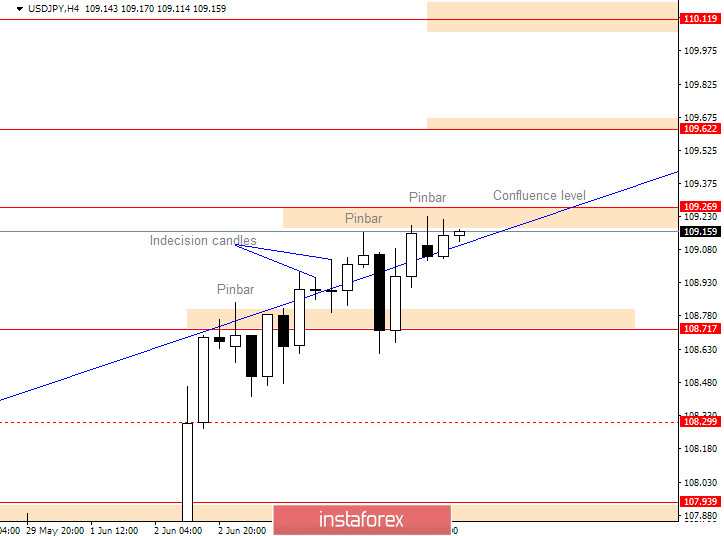
The bearish pinbar near 109.269 is also on the trendline that creates additional resistance for the price. As it looks now, we could see some confluence around this level. We could see the price making another bearish signal that could drive the price down to 108.717.
USD/JPY Chart. Bullish Scenario
Bulls are running the game for the whole week. At this point where the price is, bulls have found strong resistance. It is strong resistance that pushed the price in the past back down to 107.00.
The only way for bulls to move the price up is to close above 109.269. If they manage to close above it, they will have an open road to 110.119. One level before 110.119 that could stop the price is 109.62 which did not show strength in the past.
USD/JPY Chart. Bearish Scenario
If the price makes a strong bearish price action signal in the are around 109.269, it could be a signal that bears could drive the price down.
Bears will need to break below 108.717 if they want to see the price reaching 107.939 and if they manage to close the price below yesterday's candles low.
InstaForex analytical reviews will make you fully aware of market trends! Being an InstaForex client, you are provided with a large number of free services for efficient trading.

