 Stay
Stay 
Trading Conditions
Products
Tools


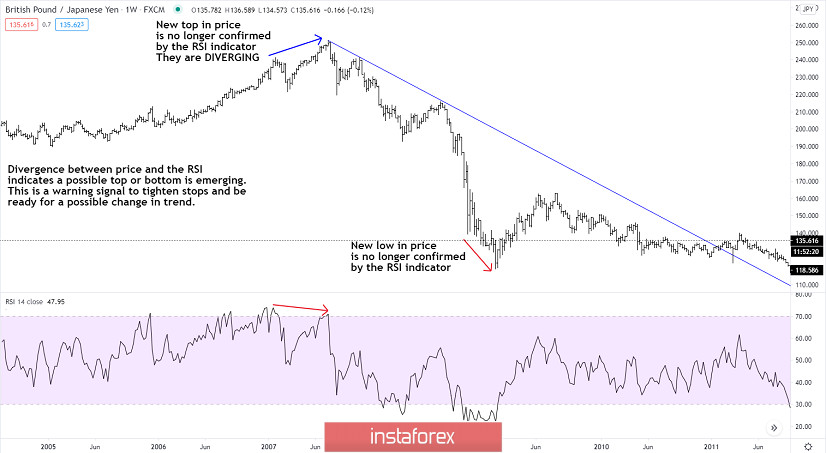
One of the best tools to get an early warning, that a possible top or bottom is close by comes from divergence between price and the RSI indicator.
Here we have taken a long-term chart of GBP ag. JPY on a weekly basis and added the RSI (14 periods), which is the standard, to look for possible divergence between price and the RSI indicator.
The first clear divergence is seen in the time-periode from Janaury 2007 to July 2007, where the price for GBP ag. JPY rallies from 241.50 i January to a new high of 251.11 i July. However, in the same time-frame the RSI indicator falls from a peak at 73.93 in January to a lower peak at 70.99 in July. This decline in the RSI was a clear warning, that a possible top was developing and more importantly, that stops on long positions in GBP ag. JPY should be tighten.
Moving forward to the periode between late October 2008 and mid-January 2009 we see a new divergence between the price og GBP ag. JPY and the RSI indicator. After a strong downtrend where GBP ag. JPY declines from 251.11 to a low of 118.82 the final part of the price-decline in GBP ag. JPY from October 2008 till January 2009 the RSI indicator no longer confirms the decline as the RSI has a higher low at January price low again showing divergence between price and the RSI indicator and again warning of a possible bottom soon and finally giving a signal to the trader, that stops should be tighten as a possible change in trend could be close at hand.
The conclusion is, that divergence between price and the RSI indicator is one of the best early warning-signals of a possible top or bottom emerging. It's not a timing tool to take a position against the prevailing trend, but a warning-tool that the prevailing trend is close to terminating.
InstaForex analytical reviews will make you fully aware of market trends! Being an InstaForex client, you are provided with a large number of free services for efficient trading.


