 Stay
Stay 
Trading Conditions
Products
Tools


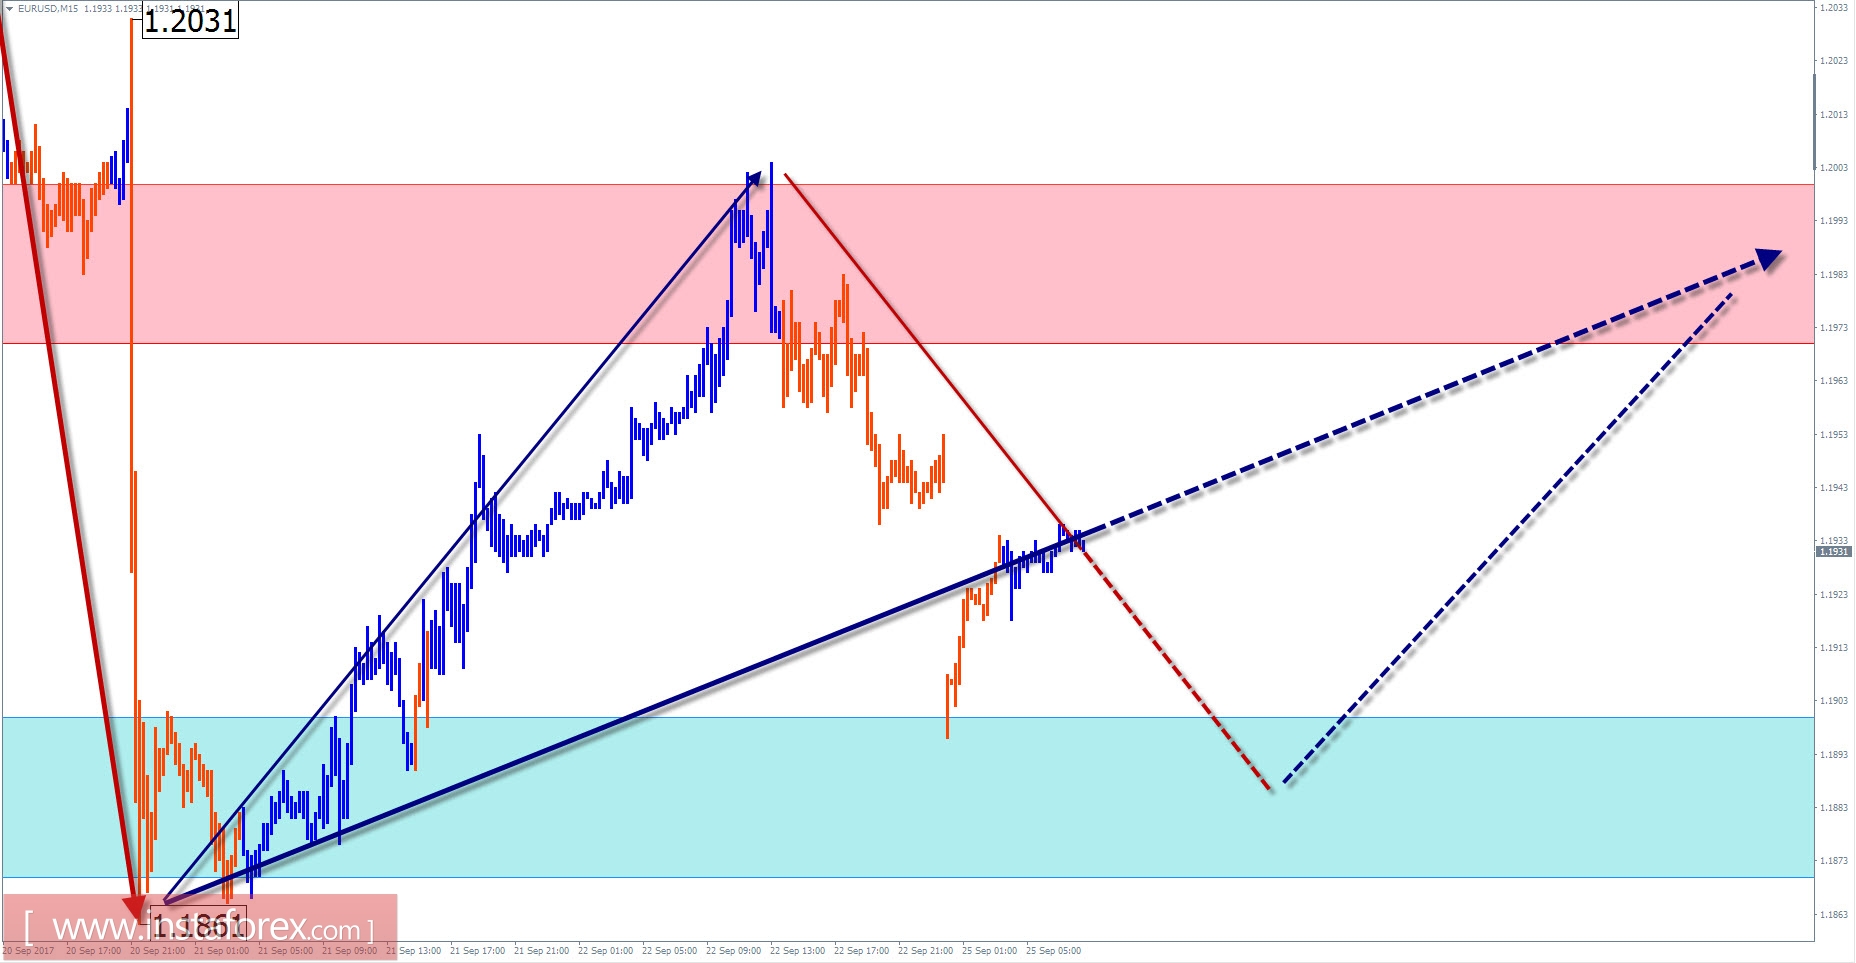
The review of EUR / USD oaurwith a forecast for the current day
EUR / USD pair outlook for the current day
Since December last year, the direction of the short-term trend of the major European currency is set in an upward wave. In a larger wave model, the "extended flat" of this section become the final part of the wave (C). The price has reached the lower limit of the potential reversal zone, where the entire wave can be completed. However, the signals for changing the direction on the chart are yet been formed. Moreover, the formation of a flat correction that ended last week implies the continuation of the trend. The fact of the formation of an upward zigzag since September 21 confirms this scenario.
Today, the completion of the corrective decline that started on the previous trading day is expected. The pair's downward turn is likely to happen in the morning. A breakout in the lower boundary of short-term is not ruled out but it is unlikely. The growth phase will become more pronounced at the end of the day or tomorrow.
Boundaries of resistance zones:
-1.1970 / 1.2000
Boundaries of support zones:
-1.1900 / 1.1870
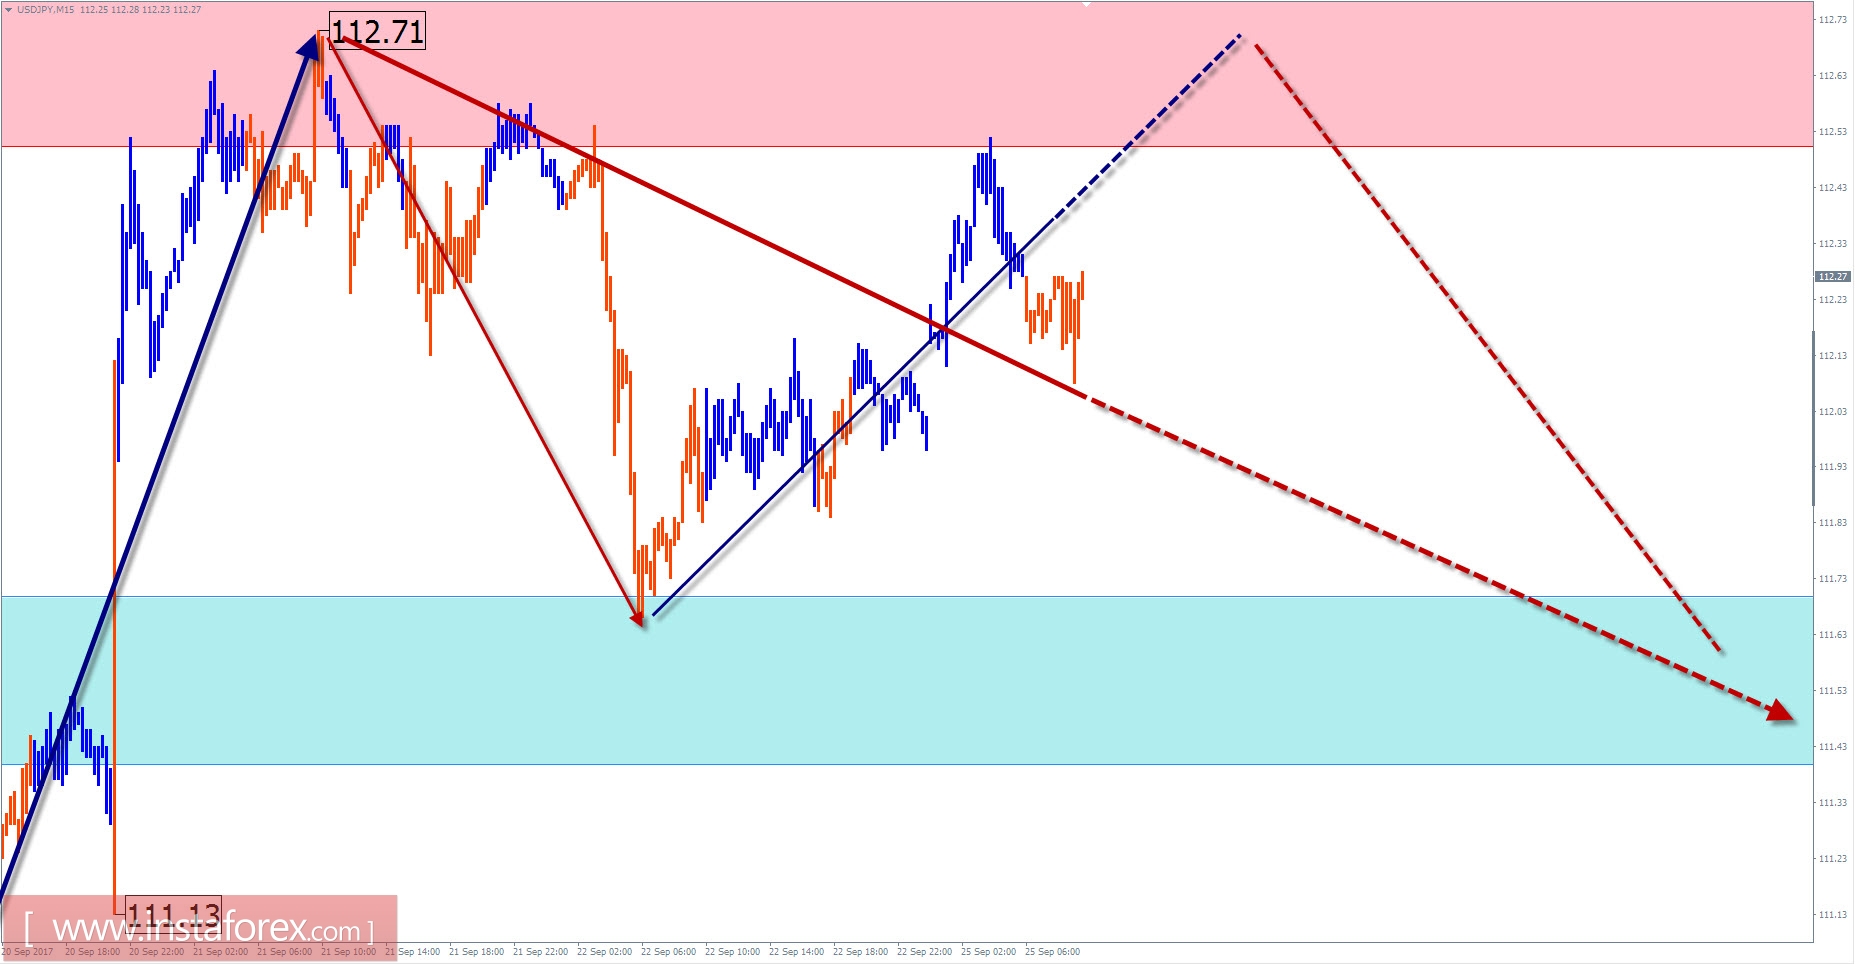
USD / JPY pair outlook for the current day
Since December last year, the rate of the major Japanese currency against the dollar, is adjusted relative to the previous momentum.
The preliminary potential of the move is estimated to have 7 price figures down in the region from the current values. Analysis of the structure of the wave indicates the formation of the middle part of the movement in the flat boundary (B) over recent months. The final segment reached the lower boundary of the preliminary completion zone.
The decline that began last Thursday has a reversal potential exceeding the size of the rollback.
Today, it is suggested to wait for the change in direction of the price after a possible attempt to push the resistance zone in this morning.
The boundaries of support will limit the scope of the daily decline.
Boundaries of resistance zones:
- 112.50 / 80
Boundaries of support zones:
- 111.70 / 40
Explanations to the figures: For simplified wave analysis, a simple waveform is used that combines 3 parts namely A, B, and C. All types of correction are created and most of the impulses can be found in these waves. Every time frame is considered and the last incomplete wave is analyzed.
The areas marked on the graphs indicate the probability of a change in the direction of motion has significantly increased as calculated in the areas. Arrows indicate the wave counting following the technique used by the author. A solid background of the arrows signify the structure has been formed while the dotted one means the expected wave motion.
Attention: The wave algorithm does not take into account the duration of the movement of tools in time. The forecast is not a trading signal! To conduct a bargain, you need to confirm the signals used by your trading systems.
InstaForex analytical reviews will make you fully aware of market trends! Being an InstaForex client, you are provided with a large number of free services for efficient trading.

