 Stay
Stay 
Trading Conditions
Products
Tools


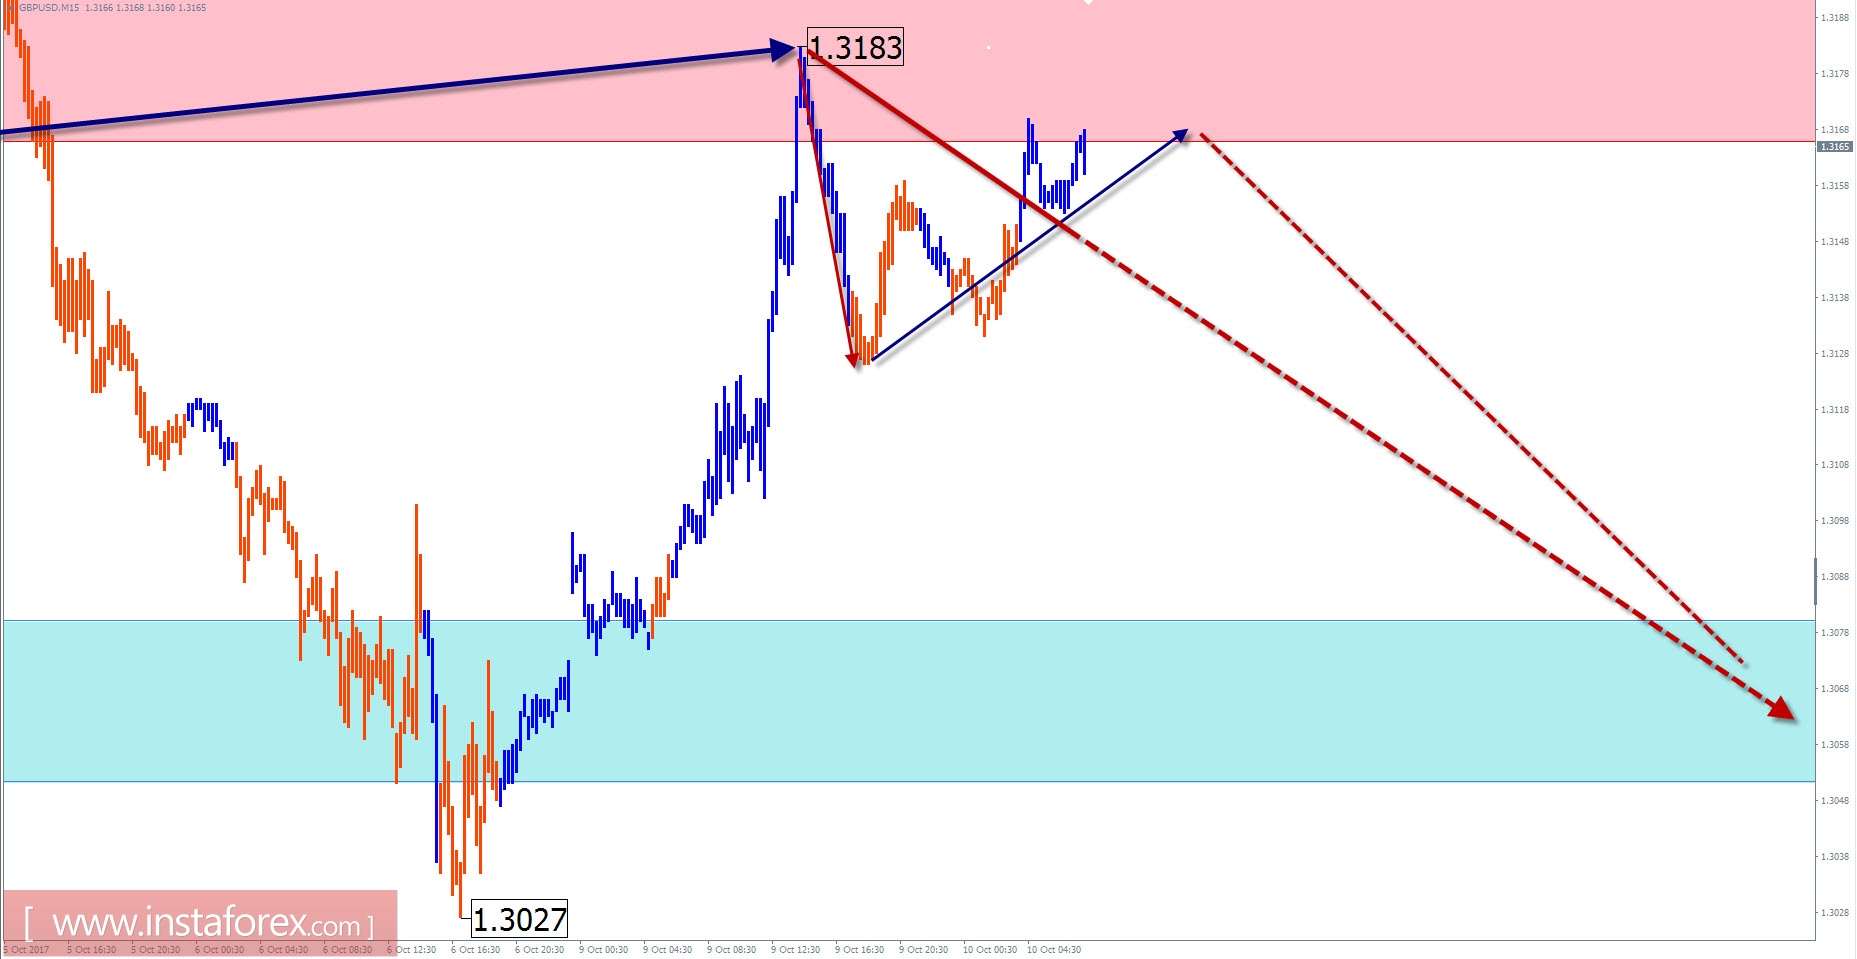
Overview of GBP / USD with a forecast for the current day
On the chart of the British pound sterling, one can state a change in the short-term trend. The downward wave, which began in the middle of last month, has a high wave level exceeding the scale of the pullback within the last segment of the main wave. There is a beginning of at least a downward correction of equal scale. The wave has a character close to the momentum. Since the end of last week, the ascending segment has started, occupying the final part of the hidden correction in the wave structure. The estimated recovery potential is limited by the limits of the calculated resistance zone.
The nearest trading session is expected to complete the ascending phase and form a reversal. The onset of active decline in time is probably closer to the end of the day.
The boundaries of the resistance zones:
- 1.3180 / 1.3210
The boundaries of the support zones:
- 1.3080 / 50
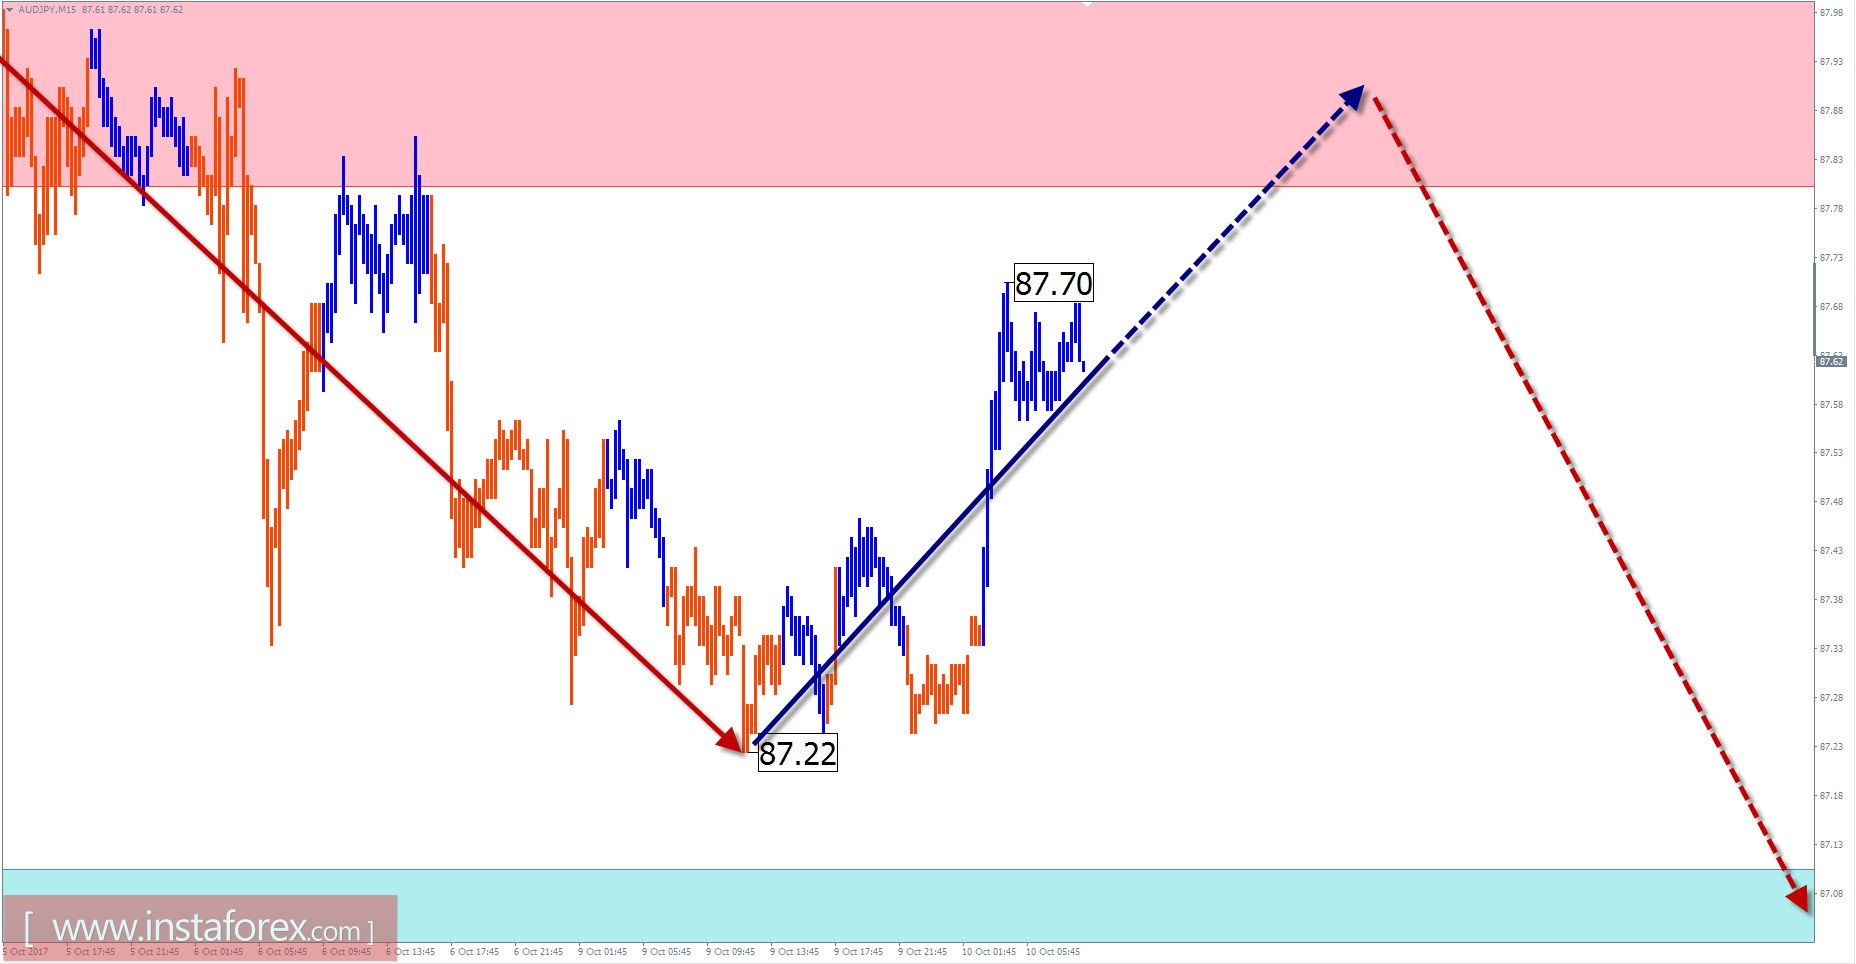
Overview of AUD / JPY with a forecast for the current day
The trend of the cross-currency pair Australian Dollar against the Japanese yen since June last year sets the rising wave. At the beginning of autumn, the price of the pair reached the boundaries of the potential reversal zone. The proportions of all parts of the wave are fully formed.
The downward wave design, which began at the end of July, has a high chance to start a counter wave of a larger scale. From September 21, the price moves down the final part of the movement (C). By the beginning of this week, the pair has reached the level of intermediate support, which has provoked the formation of a counterback.
Today, in the first half of the day, the upward mood of cross traffic is most likely. The price rise is expected not above the boundaries of the resistance zone. Toward the end of the day, the chance of a change in the motion vector and the beginning of a decrease will increase.
The boundaries of the resistance zones:
- 87.80 / 88.10
The boundaries of the support zones:
- 87.10 / 86.80
Explanations to the figures: For simplified wave analysis, a simple waveform is used that combines 3 parts (A; B; C). Of these waves, all kinds of correction are composed and most of the impulses. On each considered time frame the last, incomplete wave is analyzed.
The areas marked on the graphs are indicated by the calculation areas in which the probability of a change in the direction of motion is significantly increased. Arrows indicate the wave counting according to the technique used by the author. The solid background of the arrows indicates the structure formed, the dotted one indicates the expected wave motion.
Attention: The wave algorithm does not take into account the duration of the tool movements in time. The forecast is not a trading signal! To conduct a trade transaction, you need to confirm the signals of your trading systems.
InstaForex analytical reviews will make you fully aware of market trends! Being an InstaForex client, you are provided with a large number of free services for efficient trading.


