 Stay
Stay 
Trading Conditions
Products
Tools


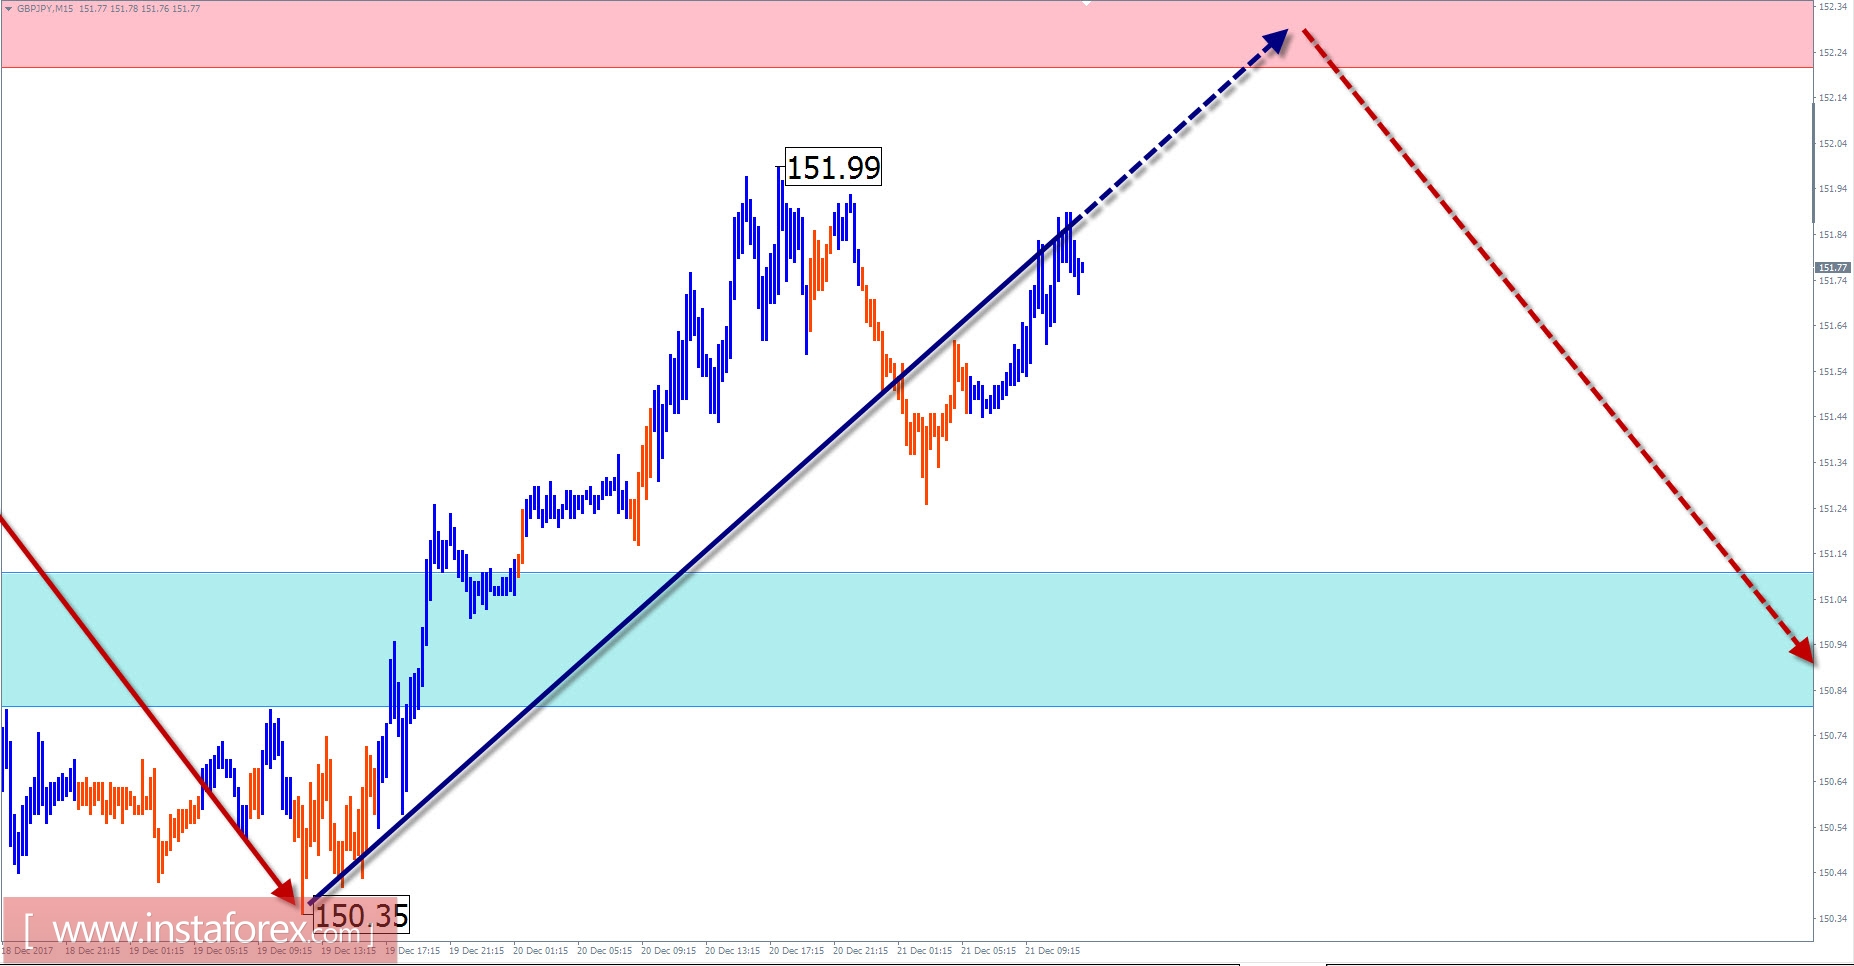
On the 4-hour chart of the British pound against the Japanese yen cross pair, conditions for changing the direction of the inter-week trend are prepared. The downward construction started on September 21 at the end of the trend wave. It develops into a flat range along the lower boundary of a powerful zone with a potential reversal. Today, the middle section (B) is nearing completion.
There is a potential for the downward segment of the chart from December 8 to begin the reversal pattern. This scenario would counter the bullish plot of 15 numbers. In this case, the resistance boundaries should become the zone of change in the basic motion vector of the quotation.
In the next trading sessions, these actions are expected: completion of the recovery, the reversal and the beginning of the price downward movement.
Boundaries of resistance zones:
- 152.20 / 50
Boundaries of support zones:
- 151.10 / 150.80
Explanations of the figures:
For simplified wave analysis, a simple waveform is used that combines 3 parts namely A, B, and C. All types of correction are created and most of the impulses can be found in these waves. Every time frame is considered and the last incomplete wave is analyzed.
The areas marked on the graphs indicate the probability of a change in the direction of motion has significantly increased as calculated in the areas. Arrows indicate the wave counting following the technique used by the author. A solid background of the arrows signifying the structure has been formed while the dotted one means the expected wave motion.
Attention: The wave algorithm does not take into account the duration of the movement of tools in time. The forecast is not a trading signal! To conduct a bargain, you need to confirm the signals used by your trading systems.
InstaForex analytical reviews will make you fully aware of market trends! Being an InstaForex client, you are provided with a large number of free services for efficient trading.

