 Stay
Stay 
Trading Conditions
Products
Tools


Overview :
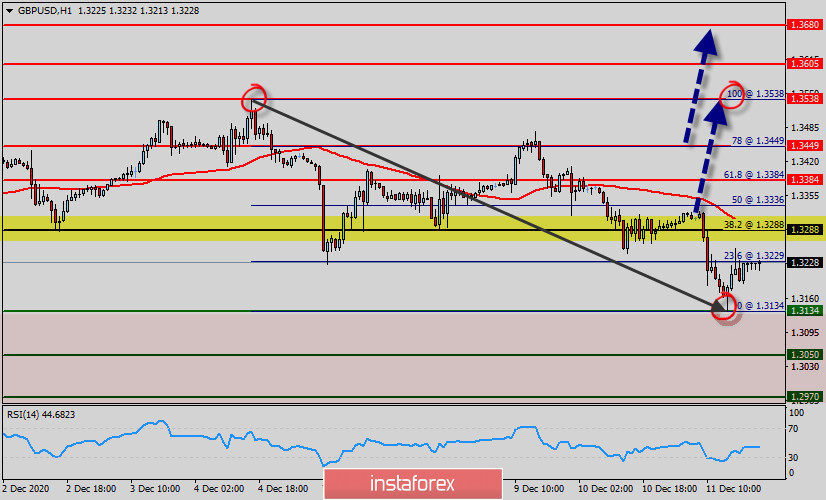
The GBP/USD pair is struggling to hold onto the level of 1.3228 (close price) after hitting a low of 1.3134 (bottom) on the H1 chart.
Last week, the GBP/USD pair dropped to as low as 1.3134 as fall form 1.3538 extends (top).
Further decline is in favor this week as long as 1.3538 major resistance holds. Current price set at the point of 1.3228.
Strong support will be found at the level of 1.3134 providing a clear signal to buy with a target seen at 1.3288 (pivot point).
On the upside, above 1.3288 minor resistance will turn intraday bias bullish market first.
In overall, we still prefer the bullish scenario as long as the price is above the level of 1.3134.
In addition, if the GBP/USD pair is able to break out the first resistance at 1.3288, the market will climp further to 1.3384.
The level of 1.3134 coincides with 38.2% of Fibonacci, which is expected to act as minor resistance today.
Since the trend is above the double bottom (1.3134), the market is still in an uptrend. Outlook will be turned bullish for 1.3134 support and above.
Some support is at the new low of 1.3134. It is followed by 1.3050, 1.3134 and 1.3050, all levels that were in play back in December.
If the trend breaks the minor resistance at 1.3288, the pair will move upwards continuing the bullish trend development to the level 1.3384 in order to test the daily resistance 1. The GBP/USD pair is showing signs of strength following a breakout of the highest level of 1.3384.
Furthermore, the trend is still showing strength above the moving average (100). Thus, the market is indicating a bullish opportunity above the above-mentioned support levels, for that the bullish outlook remains the same as long as the 100 EMA is headed to the upside.
Rise from could either be a correction or starting a long term up trend. In either case, next target will be 38.2% retracement of 1.3288 to 1.3384 at 1.3449.
This is confirmed by the RSI indicator signaling that we are still in the bullish trending market. Now, the pair is likely to begin an ascending movement to the point of 1.3449 and further to the level of 1.3538 so as to the double top.
Nevertheless, rejection by 1.3449 will maintain medium term bearishness for another lower below 1.3449 at a later stage.
InstaForex analytical reviews will make you fully aware of market trends! Being an InstaForex client, you are provided with a large number of free services for efficient trading.


