 Stay
Stay 
Trading Conditions
Products
Tools


Overview :
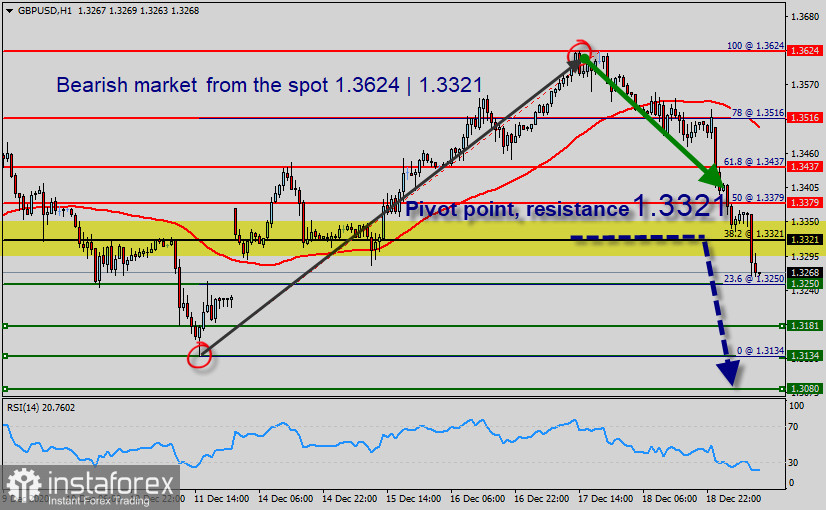
On the one-hour chart, the GBP/USD pair continues moving in a bearish trend from the resistance area of of 1.3624 - 1.3311.
The GBP/USD pair is trading below 1.3321, crashing by over 413 pips (from the top of 1.3624 to 1.3211 levels) as the UK faces supply chain issues amid travel bans imposed to stop the spread of the new Coronavirus (Covid-19) strain.
Currently, the price is in a bearish channel. This is confirmed by the RSI indicator signaling that we are still in a bullish trending market. The Relative Strength Index is nearing the 20 level, oversold conditions.
The bias remains bearish in the nearest term testing 1.3181 and 1.3134.
Immediate resistance is seen around 1.3321 levels, which coincides with the weekly pivot.
Moreover, the moving average (100) starts signaling a downward trend; therefore, the market is indicating a bearish opportunity below 1.3321.
the GBP/USD pair has fallen sharply, piercing through the 100 Simple Moving Averages on the four-hour chart and hitting the 100 SMA.
So it will be good to sell at 1.3321 with the first target of 1.3181. It will also call for a downtrend in order to continue towards 1.3134. The strong weekly support is seen at 1.3080.
However, if a breakout happens at the resistance level of 1.3379, then this scenario may be invalidated.
Forecast
Daily key levels :
InstaForex analytical reviews will make you fully aware of market trends! Being an InstaForex client, you are provided with a large number of free services for efficient trading.

