 Stay
Stay 
Trading Conditions
Products
Tools


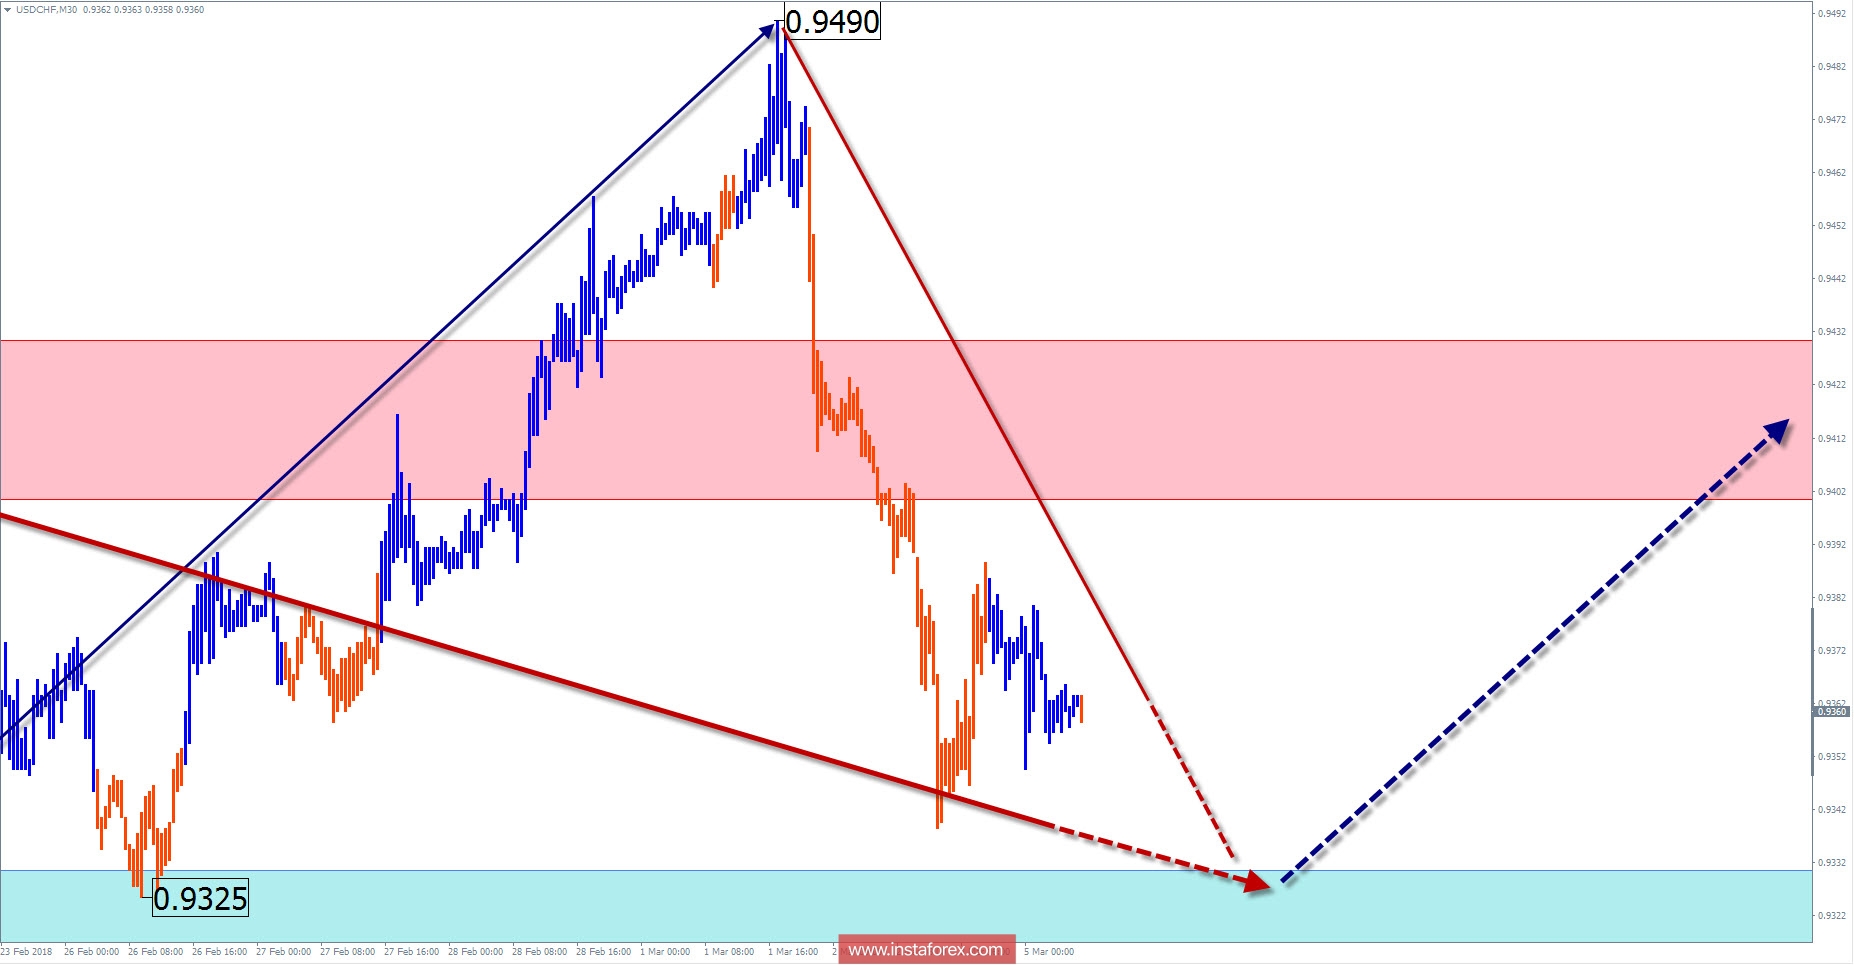
The price of the major pair Swiss franc and US dollar continues to move in the graph according to the breakthrough of the prevailing downward wave in the daily scale. In a larger ascending pattern, the wave forms a correction. The descending wave structure is already completed its formation today, but it allows for further extension.
In the previous month, the last section of the main trend from October 27, 2017 collided with the upper limit of the potentially large-scale reversal zone. The structural figure "expanding triangle" formed in the hourly chart shows an oncoming wave formation.
Today, the completion of the downward rollback and creating conditions for changing the course are expected. The ascending phase the of price movement expected at the end of the day or tomorrow.
Boundaries of resistance zones:
- 0.9400 / 0.9430
Boundaries of support zones:
- 0.9330 / 0.9300
Explanations to the figures: For simplified wave analysis, the simplest type of wave is used in the form of a zigzag, combining 3 parts (A; B; C). Of these waves, all kinds of correction are composed and most of the impulses. At each time frame, the last, incomplete wave is analyzed.
The areas marked on the graphs are indicated by the calculation areas, where the probability of a change in the direction of motion is significantly increased. Arrows indicate the wave counting according to the technique used by the author. The solid background of the arrows indicates the structure formed, the dotted one indicates the expected wave motion.
Attention: The wave algorithm does not take into account the duration of the tool movements in time. The forecast is not a trading signal! To conduct a trade transaction, you need to confirm the signals of your trading systems.
* The presented market analysis is informative and does not constitute a guide to the transaction.
InstaForex analytical reviews will make you fully aware of market trends! Being an InstaForex client, you are provided with a large number of free services for efficient trading.

