 Stay
Stay 
Trading Conditions
Products
Tools


When analyzing the weekly scale of the chart of the main pair of Swiss francs, the last unfinished construction since January 2015 is the rising wave. Over the past year, the chart has formed a downward trend, occupying the final part of the correction in the wave structure. The quotations of the pair have reached the minimum required level of elongation down. All parts of the correctional phase of motion look proportional. The preliminary target zone has been reached.
The ascending section, which started on February 16, has a reversal potential. It is likely that the bull wave will form a higher wave level in the coming month.
In the upcoming trading week, the price should work out a counter-rollback. The likely area for its completion is the support zone. Next, you can wait for a second attempt to climb, up to the far upper zone of resistance.
The boundaries of resistance zones:
- 0.9770 / 0.9820
- 0.9580 / 0.9630
The boundaries of support zones:
- 0.9440 / 0.9390
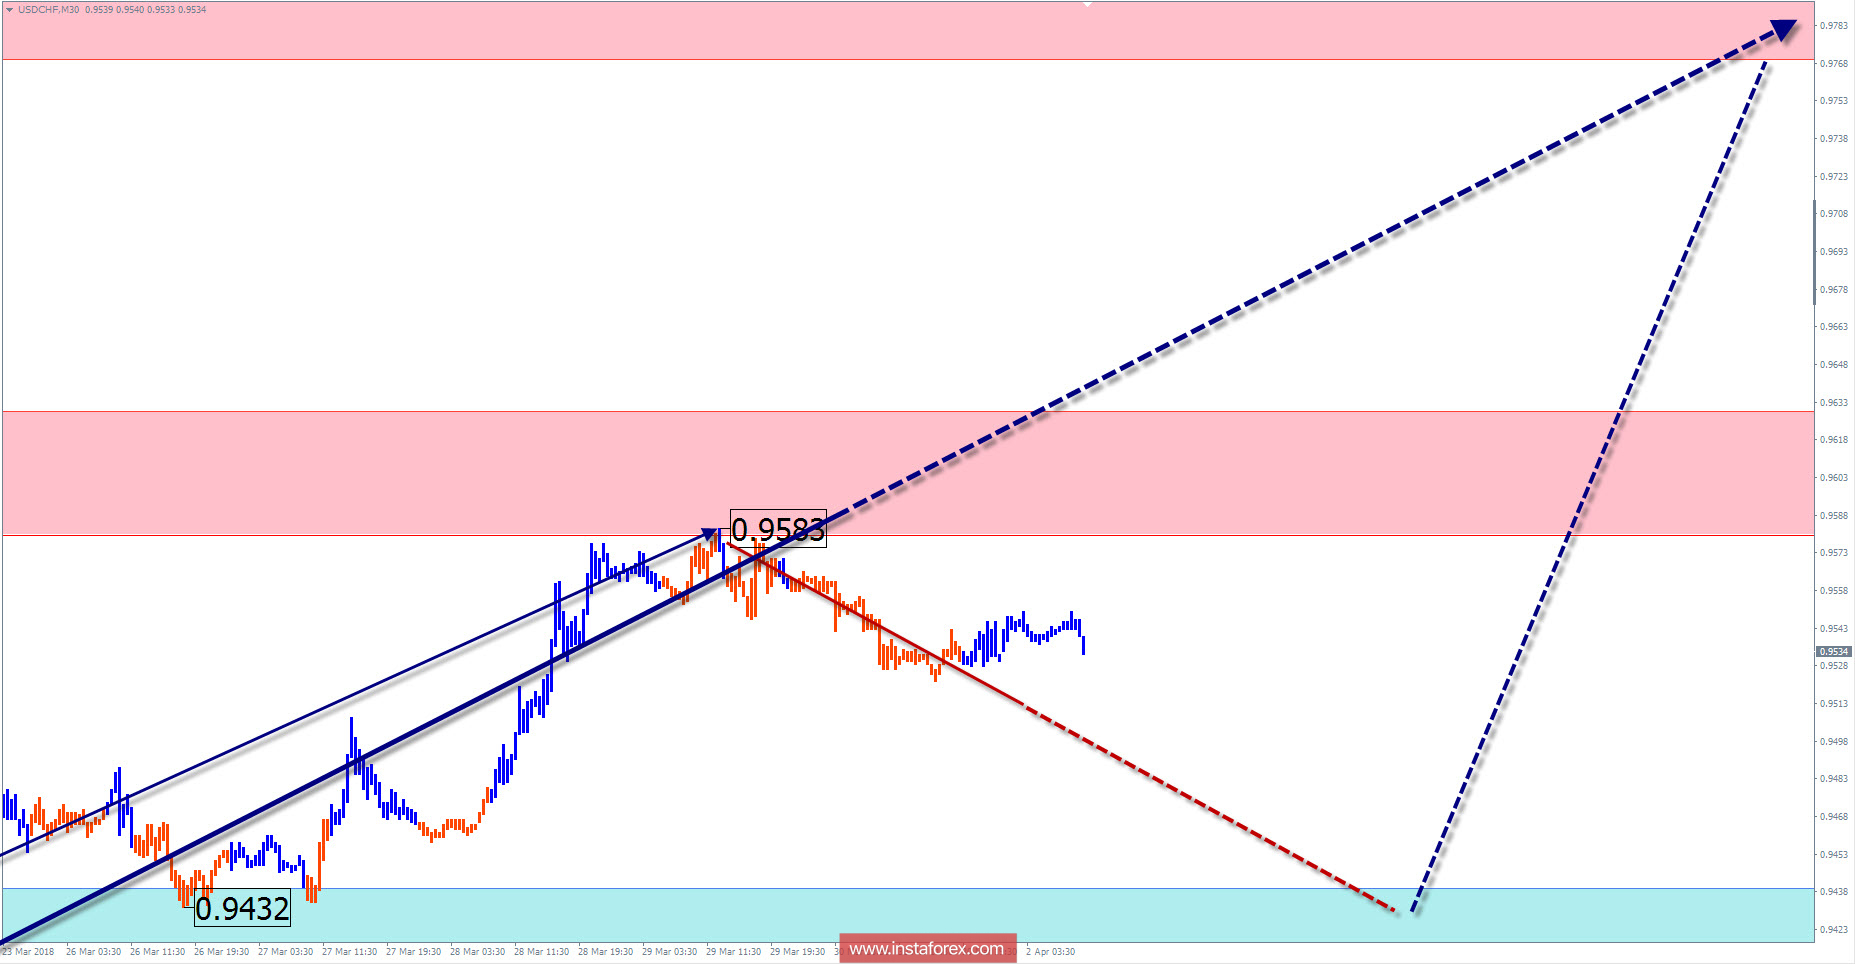
Explanations to the figures: For simplified wave analysis, the simplest type of wave is used in the form of a zigzag, combining 3 parts (A; B; C). Of these waves, all kinds of correction are composed and most of the impulses. At each time frame, the last, incomplete wave is analyzed.
The areas marked on the graphs are indicated by the calculation areas, where the probability of a change in the direction of motion is significantly increased. Arrows indicate the wave counting according to the technique used by the author. The solid background of the arrows indicates the structure formed, the dotted one indicates the expected wave motion.
Attention: The wave algorithm does not take into account the duration of the tool movements in time. The forecast is not a trading signal! To conduct a trade transaction, you need to confirm the signals of your trading systems.
InstaForex analytical reviews will make you fully aware of market trends! Being an InstaForex client, you are provided with a large number of free services for efficient trading.


