 Stay
Stay 
Trading Conditions
Products
Tools


Analyzing the wave of the picture of the major Canadian dollar daily scale on the daily chart, the last descending zigzag stands out. Since September of last year, a counter-corrective wave has been formed within the framework of the last part (C), which entered the final phase. The lower boundary of the preliminary target zone is the maximum price.
The March pullback of the price moved down, which only briefly pushed the end of the current bullish wave.
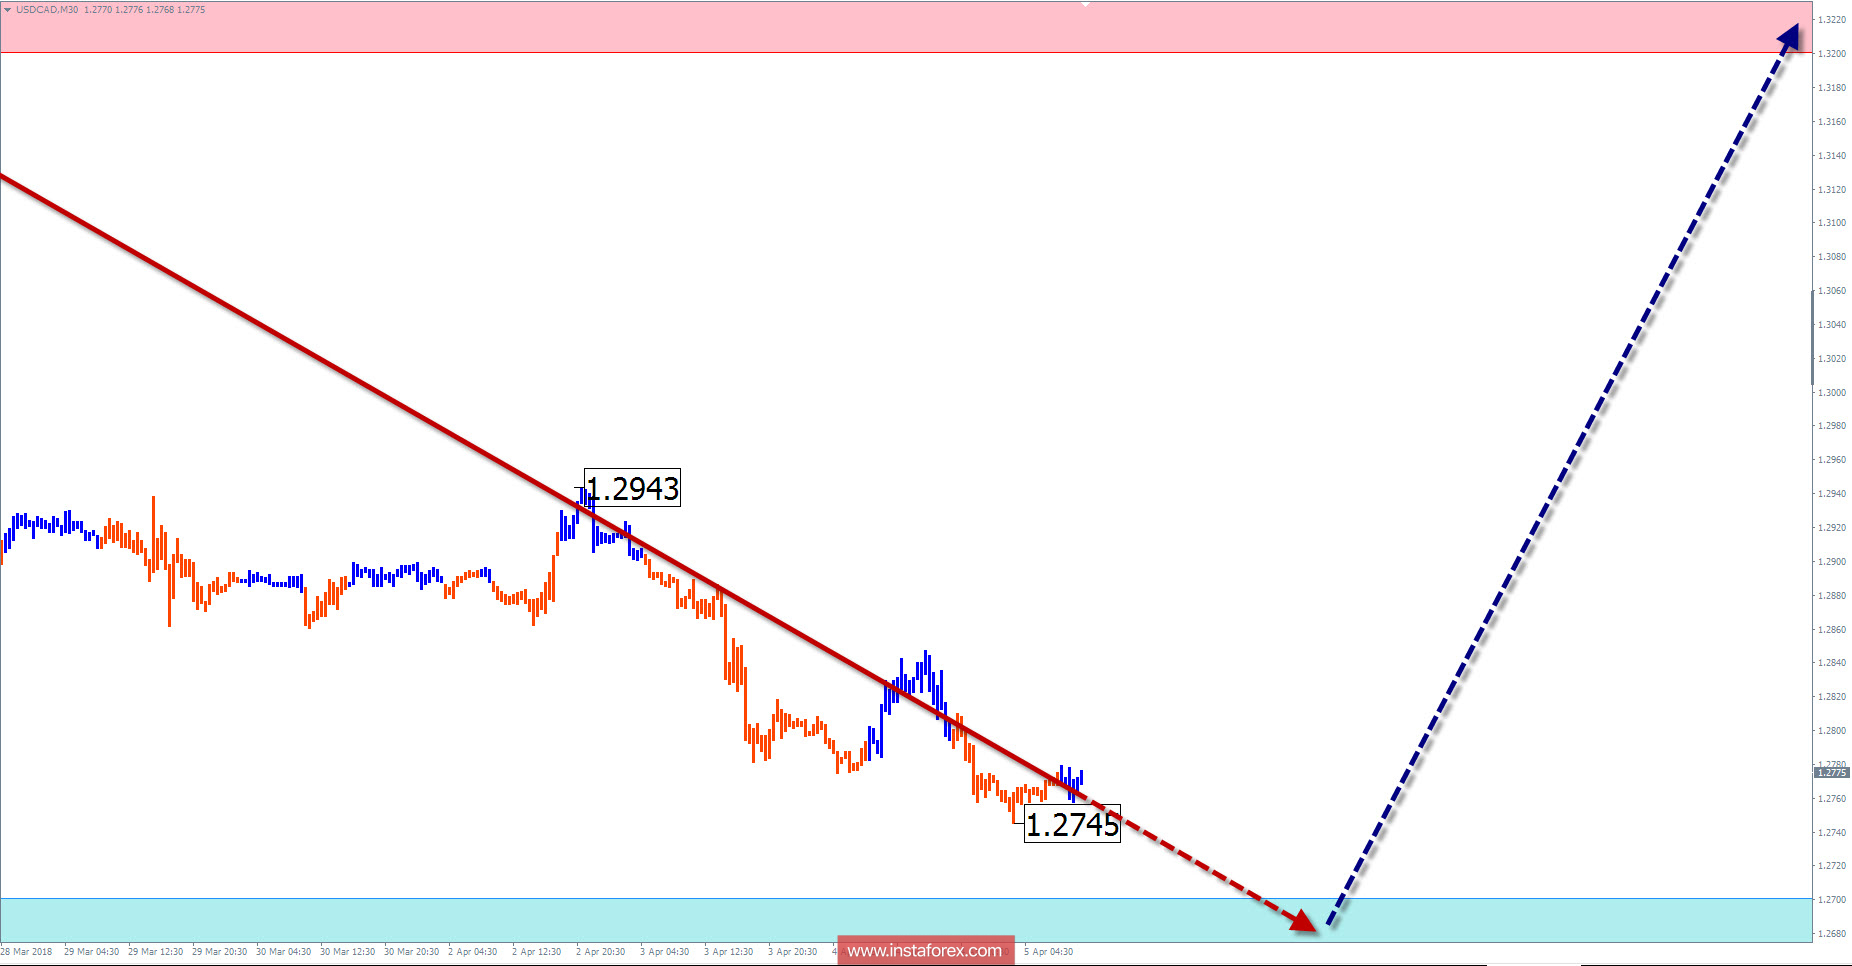
In the coming days, the pair is expected to end the decline. The most likely zone is the settlement support area. Further, the price is expected to turn and price rise, down to the lower level of the control potential reversal zone.
Boundaries of resistance zones:
- 1.3200 / 1.3250
Boundaries of support zones:
- 1.2700 / 1.2650
Explanations of the figures:
For simplified wave analysis, a simple waveform is used that combines 3 parts namely A, B, and C. All types of correction are created and most of the impulses can be found in these waves. Every time frame is considered and the last incomplete wave is analyzed.
The areas marked on the graphs indicate the probability of a change in the direction of motion has significantly increased as calculated in the areas. Arrows indicate the wave counting following the technique used by the author. A solid background of the arrows signifying the structure has been formed while the dotted one means the expected wave motion.
Attention: The wave algorithm does not take into account the duration of the movement of tools in time. The forecast is not a trading signal! To conduct a bargain, you need to confirm the signals used by your trading systems.
InstaForex analytical reviews will make you fully aware of market trends! Being an InstaForex client, you are provided with a large number of free services for efficient trading.

