 Stay
Stay 
Trading Conditions
Products
Tools


At the end of 2016, the downward wave began on the chart of the major currency Japanese yen is close to completion on many grounds. In favor of this version, it indicates the completeness of the structure and proportionality of all parts of the wave. At the price, the preliminary target zone of potential reversal was achieved. The possible onset of the counterwave formation on this section of the graph is very high.
The chart has not yet formed a clear reversal pattern, so the change in the course in the coming weeks cannot be unchanged. In the coming days, the price will reach the boundaries of the calculated resistance zone where the chance of possible reversal increases sharply. Further, the price decline is expected.
The scope of the control zone enables the possible downward movement of the price before changing the trend direction up to 3 price figures
Boundaries of resistance zones:
- 108.00 / 108.50
Boundaries of support zones:
- 105.70 / 105.20
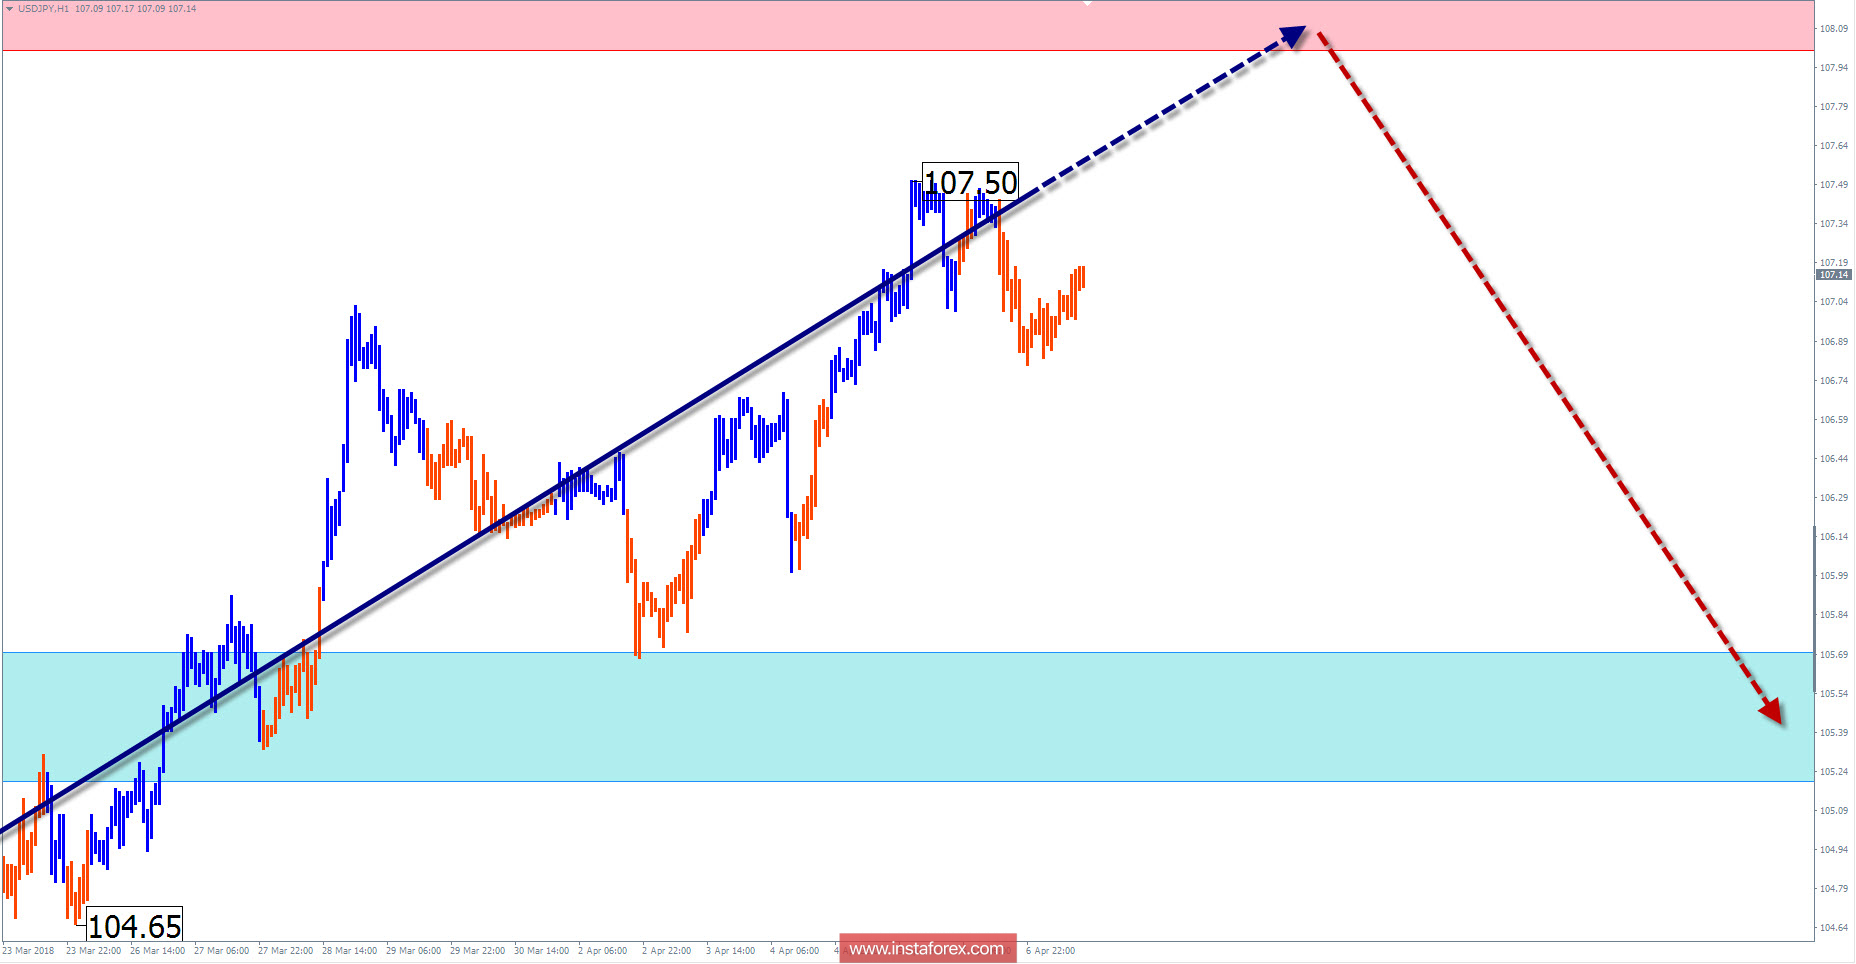
Explanations to the figures: For simplified wave analysis, the simplest type of wave is used in the form of a zigzag, combining 3 parts (A; B; C). Of these waves, all kinds of correction are composed and most of the impulses. At each time frame, the last, incomplete wave is analyzed.
The areas marked on the graphs are indicated by the calculation areas, where the probability of a change in the direction of motion is significantly increased. Arrows indicate the wave counting according to the technique used by the author. The solid background of the arrows indicates the structure formed, the dotted one indicates the expected wave motion.
Attention: The wave algorithm does not take into account the duration of the tool movements in time. The forecast is not a trading signal! To conduct a trade transaction, you need to confirm the signals of your trading systems.
* The presented market analysis is informative and does not constitute a guide to the transaction
InstaForex analytical reviews will make you fully aware of market trends! Being an InstaForex client, you are provided with a large number of free services for efficient trading.

