 Stay
Stay 
Trading Conditions
Products
Tools


Since January 2016, the descending wave of the instrument lacks the final phase to complete the end. The price of the pair is being adjusted since August last year. This section of the wave is approaching its logical conclusion. In the structure of a bullish wave, a distinct zigzag can be traced.
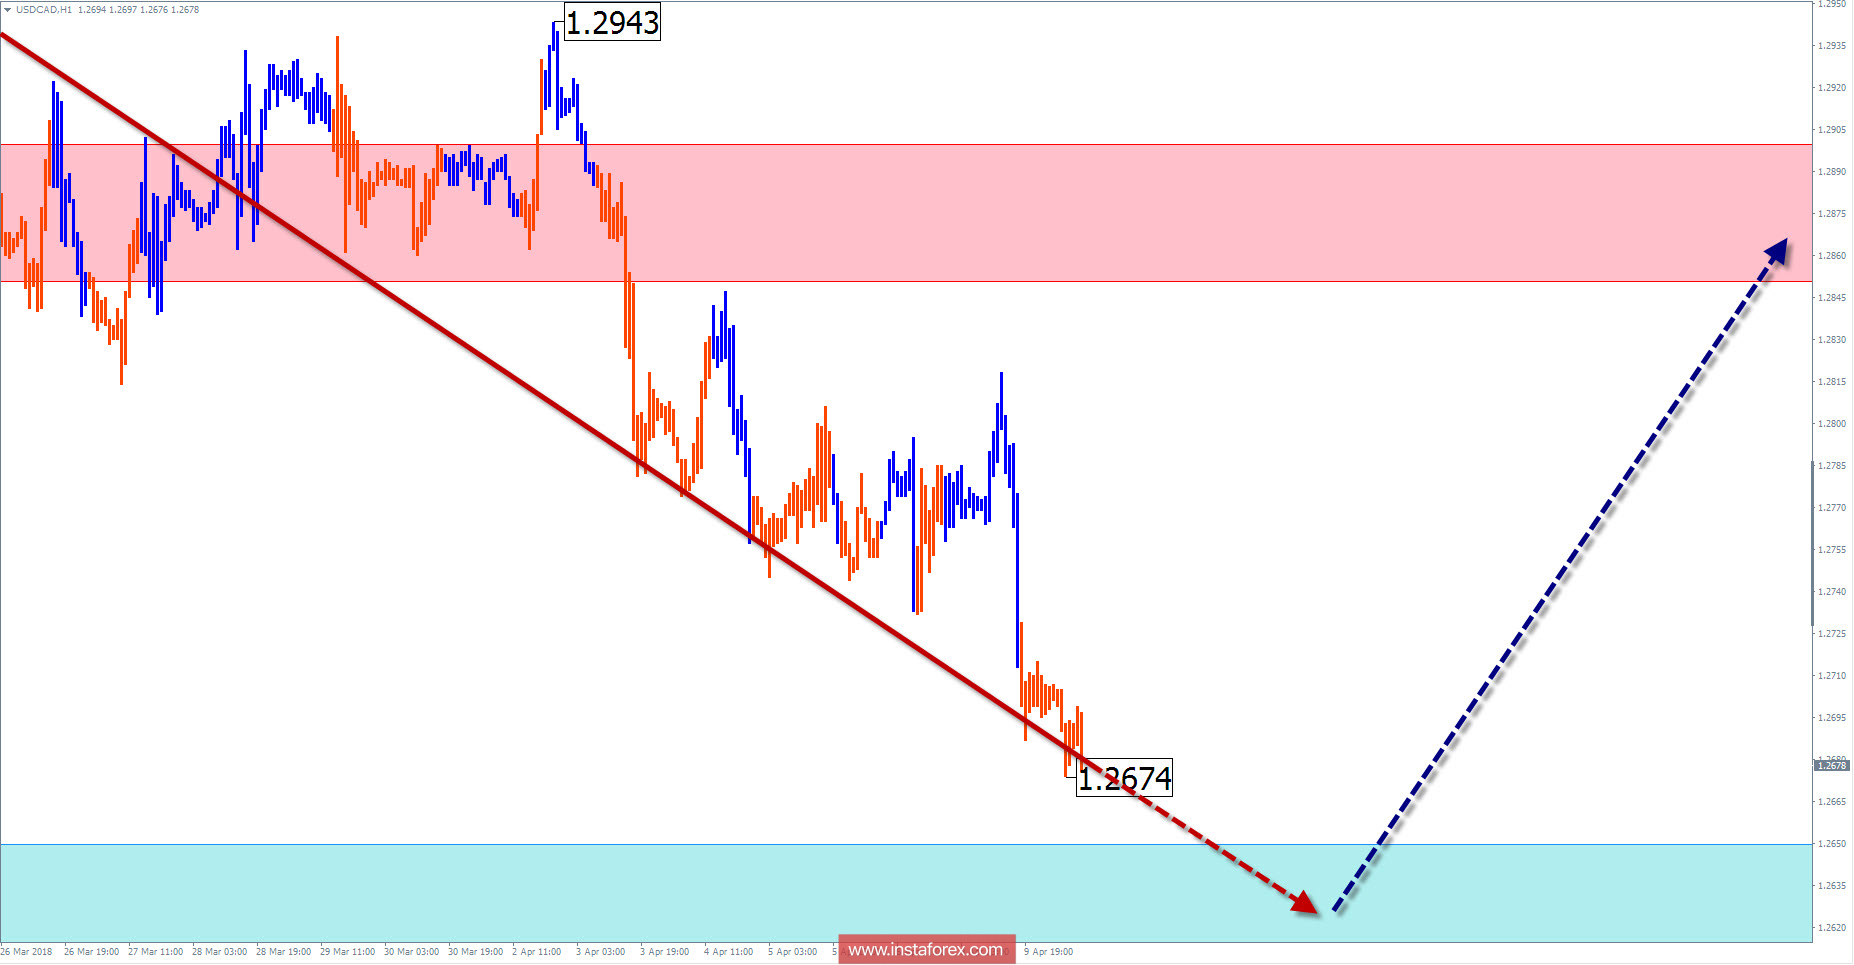
For the last month, the price of the pair is rolling away from the lower boundary of the wide zone of the potential reversal, where there is a large chance in completing the recovery of the pair. In turn, the decline of quotes has reached the upper limit of strong support within the last section of the wave, which can become a reversal zone of the chart.
In the coming days, the price of the pair will seize for the "bottom". There is a small probability of a breakthrough in the lower head of the calculated support zone. In the following days, you can count on the change in the basic motion vector.
Boundaries of resistance zones:
- 1.2850 / 1.2900
Boundaries of support zones:
- 1.2650 / 1.2600
Explanations of the figures:
For simplified wave analysis, a simple waveform is used that combines 3 parts namely A, B, and C. All types of correction are created and most of the impulses can be found in these waves. Every time frame is considered and the last incomplete wave is analyzed.
The areas marked on the graphs indicate the probability of a change in the direction of motion has significantly increased as calculated in the areas. Arrows indicate the wave counting following the technique used by the author. A solid background of the arrows signifying the structure has been formed while the dotted one means the expected wave motion.
Attention: The wave algorithm does not take into account the duration of the movement of tools in time. The forecast is not a trading signal! To conduct a bargain, you need to confirm the signals used by your trading systems.
InstaForex analytical reviews will make you fully aware of market trends! Being an InstaForex client, you are provided with a large number of free services for efficient trading.


