 Stay
Stay 
Trading Conditions
Products
Tools


The uptrend of the most volatile currency market. Beginning in autumn 2016, the bullish wave has gotten a high wave level by now, comparable to the scale of the previous bearish trend. In a larger wave model, this area became the final part (C), hence, the nature of the price movement is close to the impulse. Counter corrective movements in such waves have the form of a flat or minimal rollback.
In February, the price of the pair reached the lower limit of the level with a potential for a reversal, which caused a sharp price decline and completed the hidden correction. With a high degree of probability, the bullish movement beginning on March 5 gave rise to a new section of the main trend.
In the upcoming week, the main direction of the pair will be upward. The resistance zone shows the most anticipated level of recovery.Prior to this in the next couple of days, there is a possibility of a short-term decline but not beyond the support zone.
Boundaries of resistance zones:
- 156.30 / 156.80
Boundaries of support zones:
- 152.20 / 151.70
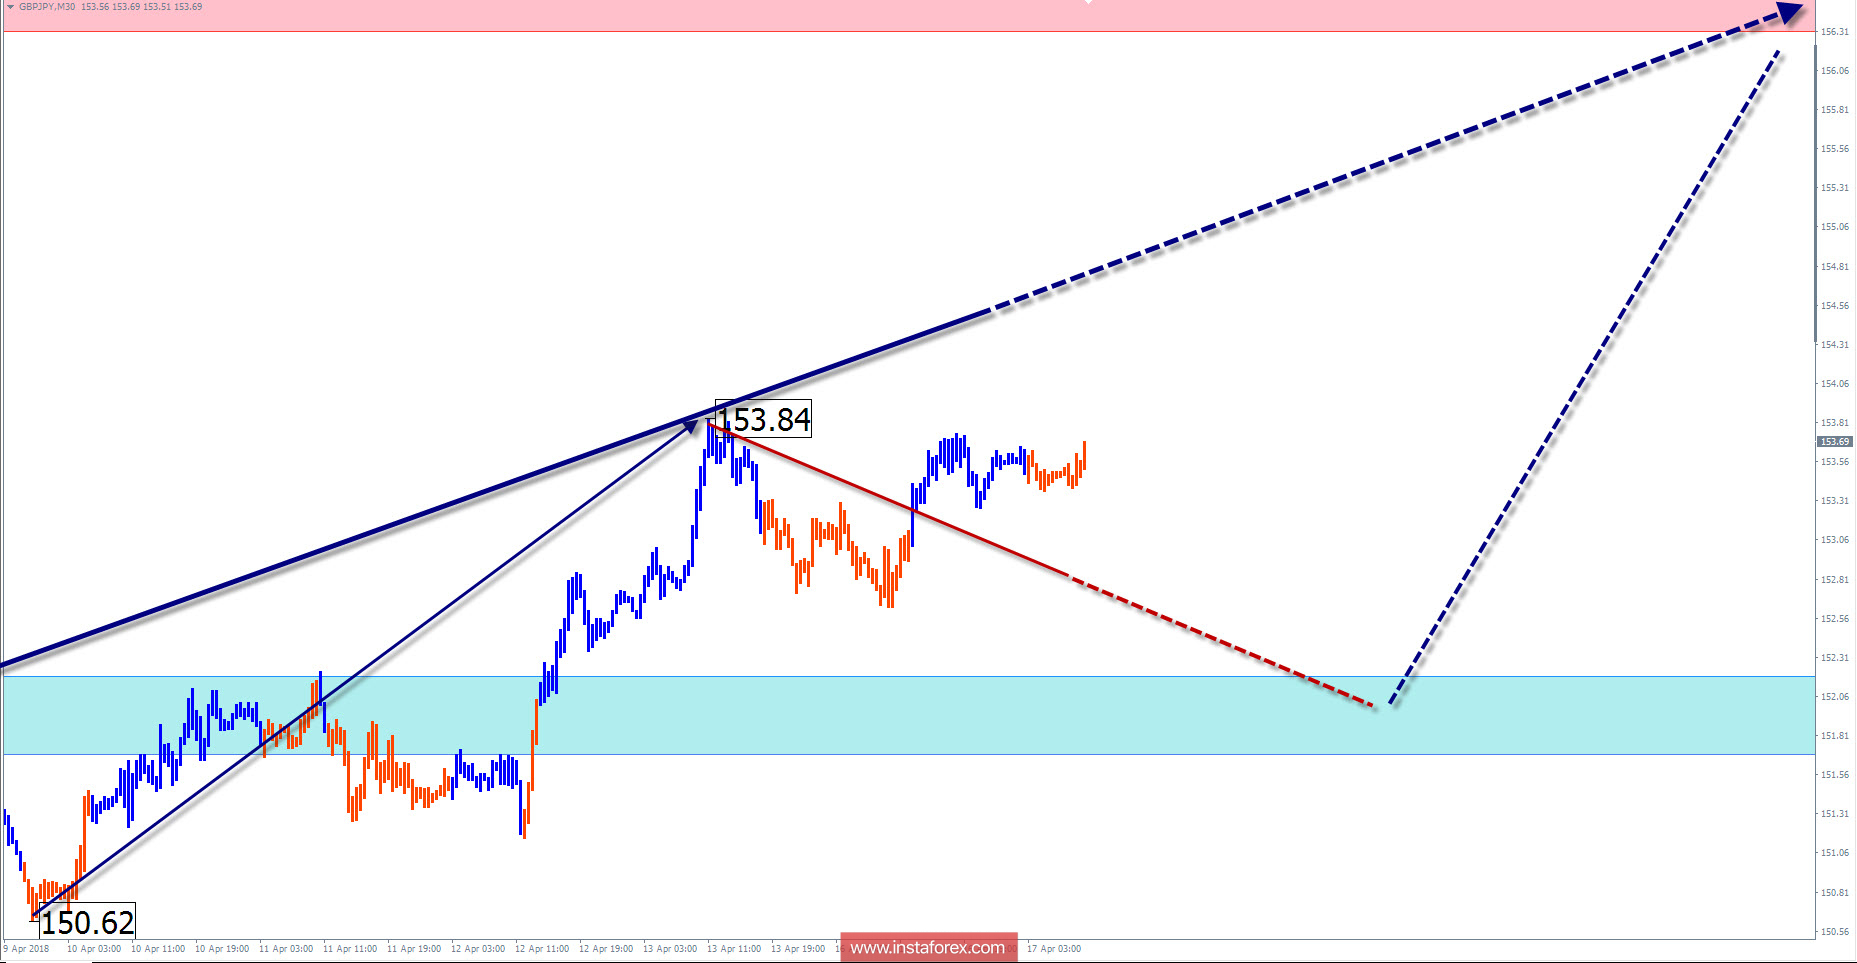
Explanations of the figures:
For simplified wave analysis, a simple waveform is used that combines 3 parts namely A, B, and C. All types of correction are created and most of the impulses can be found in these waves. Every time frame is considered and the last incomplete wave is analyzed.
The areas marked on the graphs indicate the probability of a change in the direction of motion has significantly increased as calculated in the areas. Arrows indicate the wave counting following the technique used by the author. A solid background of the arrows signifying the structure has been formed while the dotted one means the expected wave motion.
Attention: The wave algorithm does not take into account the duration of the movement of tools in time. The forecast is not a trading signal! To conduct a bargain, you need to confirm the signals used by your trading systems.
InstaForex analytical reviews will make you fully aware of market trends! Being an InstaForex client, you are provided with a large number of free services for efficient trading.

