 Stay
Stay 
Trading Conditions
Products
Tools


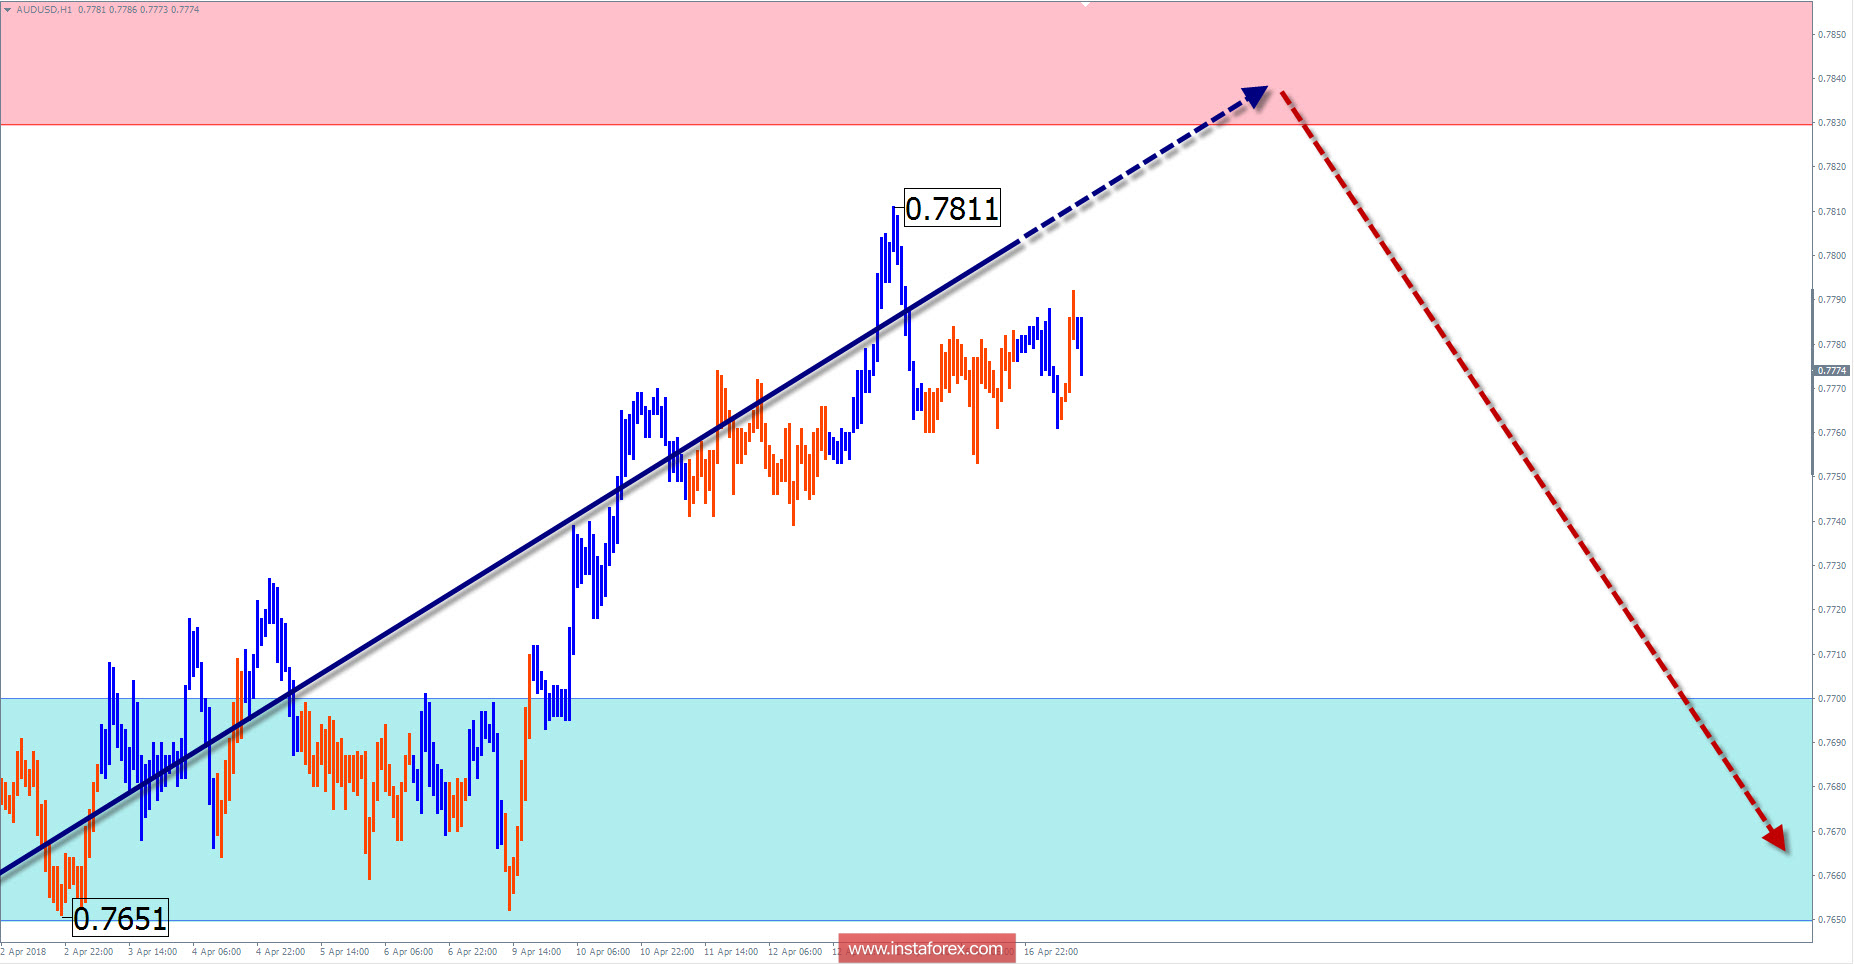
The current trend on the chart of the "Aussie" major currency pair remains a bullish trend. The potential price hike in the last 2 years is high enough to further expect the formation of the remaining parts of the wave (B, C). This will create conditions for the formation of an ascending wave of a larger scale.
Correction on the graph began to form from September last year, after contact with the lower boundary of the potential turn area. It looks like a standard plane. At the time of analysis, it lacks the final section. Preliminary calculation allows you to wait for the price move down, right up to the beginning of the 75th price figure.
In the coming days, you can bet on the turn of the course. The most probable zone is the design resistance. Support levels will reduce the rate of subsequent decline.
Boundaries of resistance zones:
- 0.7830 / 0.7880
Boundaries of support zones:
- 0.7700 / 0.7650
Explanations of the figures:
For simplified wave analysis, a simple waveform is used that combines 3 parts namely A, B, and C. All types of correction are created and most of the impulses can be found in these waves. Every time frame is considered and the last incomplete wave is analyzed.
The areas marked on the graphs indicate the probability of a change in the direction of motion has significantly increased as calculated in the areas. Arrows indicate the wave counting following the technique used by the author. A solid background of the arrows signifying the structure has been formed while the dotted one means the expected wave motion.
Attention: The wave algorithm does not take into account the duration of the movement of tools in time. The forecast is not a trading signal! To conduct a bargain, you need to confirm the signals used by your trading systems.
InstaForex analytical reviews will make you fully aware of market trends! Being an InstaForex client, you are provided with a large number of free services for efficient trading.


