 Stay
Stay 
Trading Conditions
Products
Tools


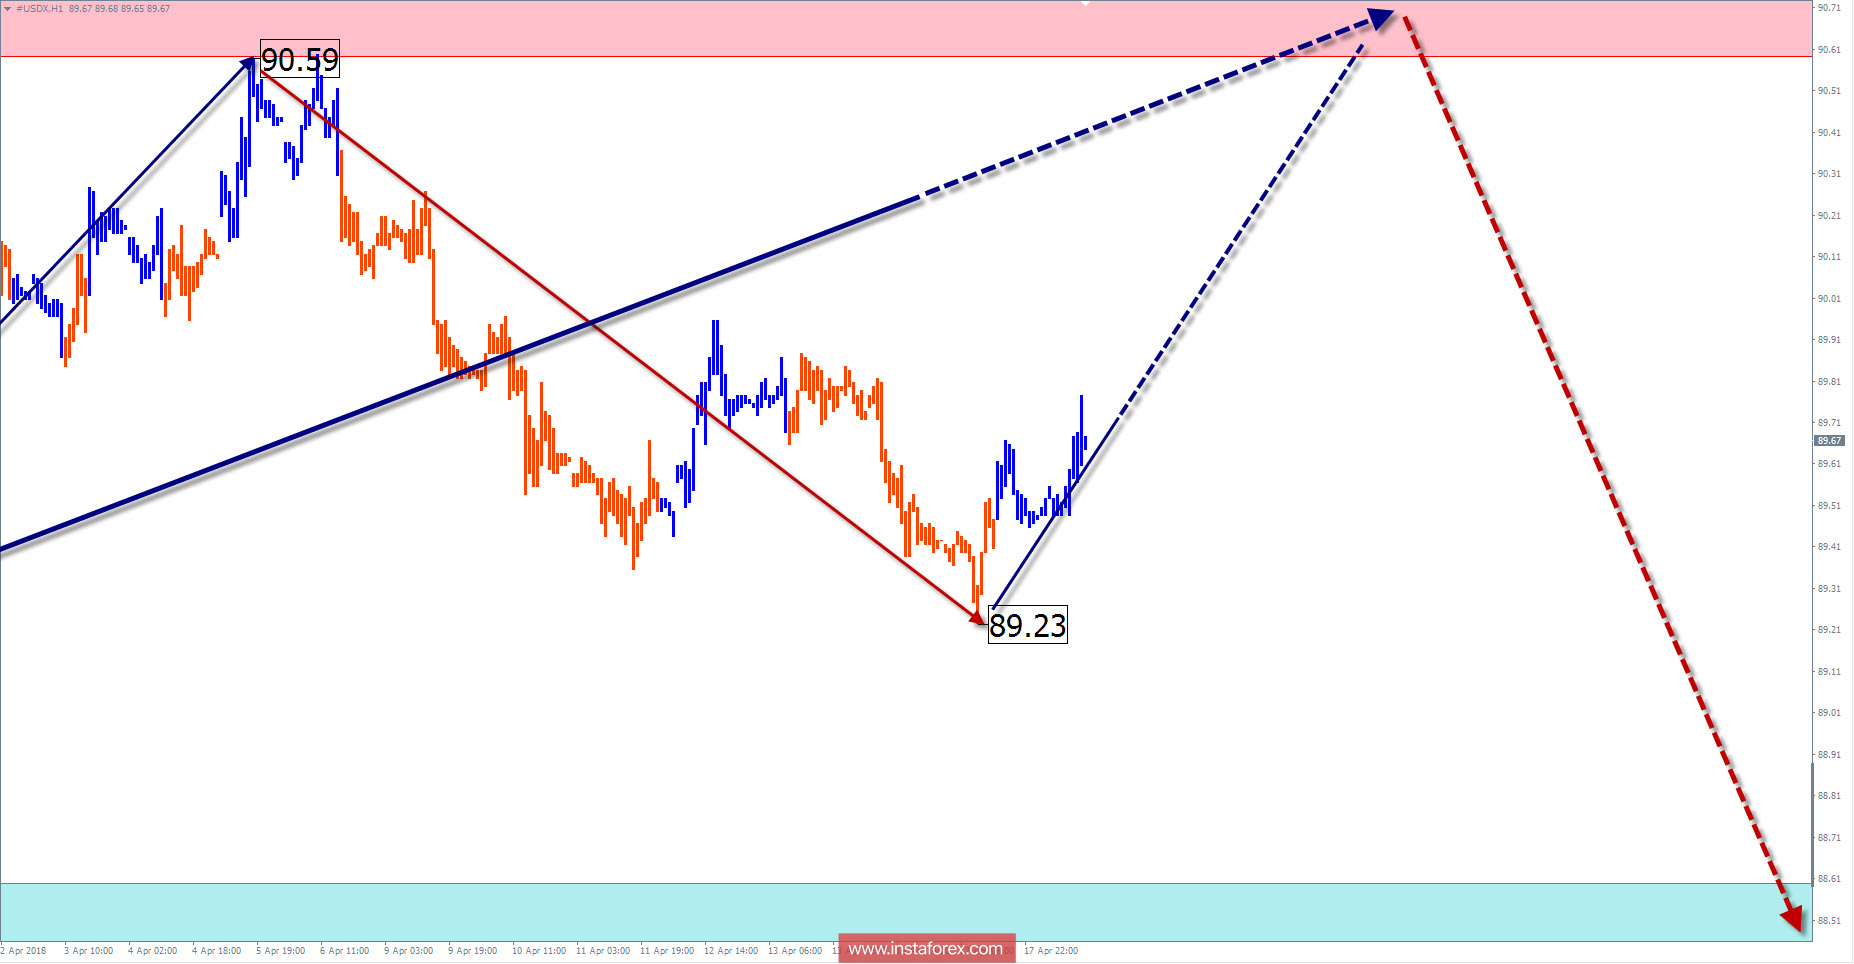
A direction of short-term trends in the US dollar index depends entirely on the process of forming the basic wave model "descending expanded flat". In the wave, the internal structure is closely monitored. The final section of the wave started since the beginning of 2017 and has a high chance to continue its formation this year.
Since February, the dollar's rate has slipped into a drift. According to the chart, extremes continued to form the "flat triangle" figure. Next week, there is a high probability of completing the corrective phase. The short-term recovery of the course is not excluded but not beyond the borders of resistance. Eventually, it is worth waiting for the reversal and the outset of a new round of the US currency decline.
Boundaries of resistance zones:
- 90.60 / 90.80
Boundaries of support zones:
- 88.60 / 88.40
Explanations to the figures: For simplified wave analysis, the simplest type of wave is used in the form of a zigzag, combining 3 parts (A; B; C). Of these waves, all kinds of correction are composed and most of the impulses. At each time frame, the last, incomplete wave is analyzed.
The areas marked on the graphs are indicated by the calculation areas, where the probability of a change in the direction of motion is significantly increased. Arrows indicate the wave counting according to the technique used by the author. The solid background of the arrows indicates the structure formed, the dotted one indicates the expected wave motion.Attention: The wave algorithm does not take into account the duration of the tool movements in time. The forecast is not a trading signal! To conduct a trade transaction, you need to confirm the signals of your trading systems.
* The presented market analysis is informative and does not constitute a guide to the transaction.
InstaForex analytical reviews will make you fully aware of market trends! Being an InstaForex client, you are provided with a large number of free services for efficient trading.


