 Stay
Stay 
Trading Conditions
Products
Tools


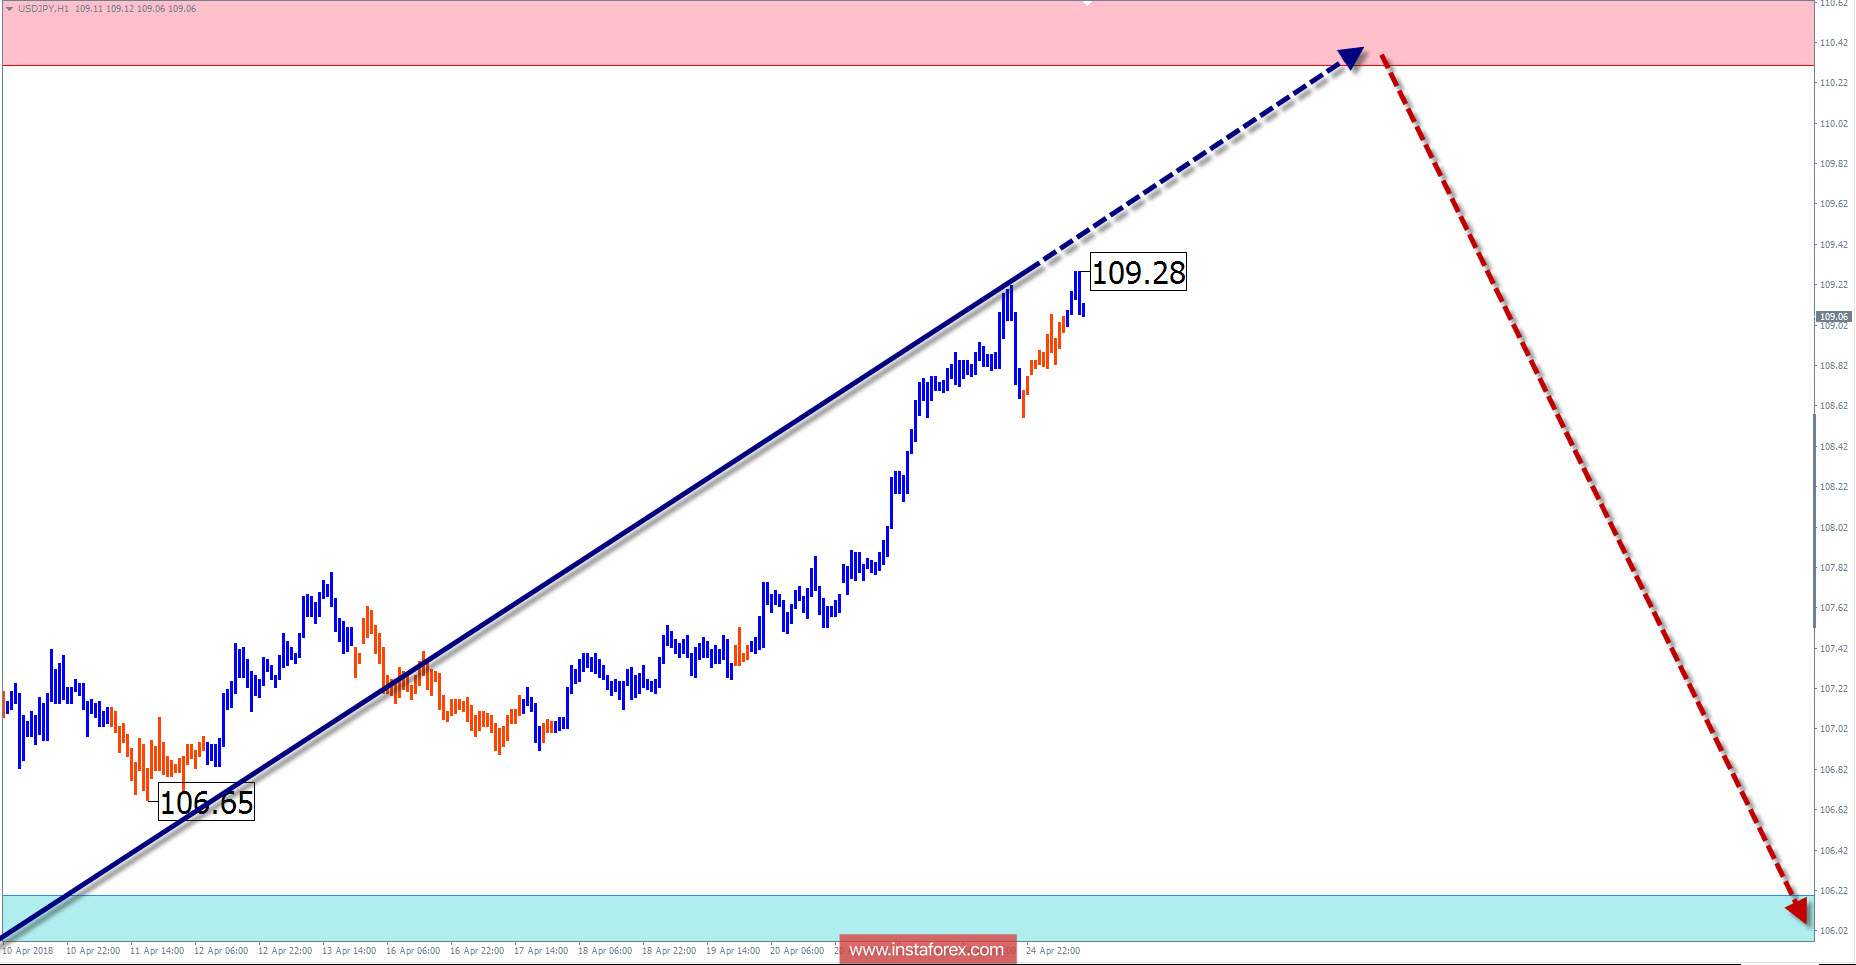
The price-zone of the potential reversal gave rise to an upward pullback. The potential of this section of the schedule is insufficient to change the course of traffic. The most likely level of completion of the price rise is within the calculated resistance zone. Further, one of two options is possible: A turn and continuation of a bearish wave, or an enlargement of the current upward construction to the required scale and a change in the direction of the trend.
In the coming trading sessions, an upward price movement is expected, up to and including contact with the resistance zone. In the following days, you can count on the turn and the price of the pair down.
The boundaries of resistance zones:
- 110.30 / 110.80
The boundaries of support zones:
- 106.20 / 105.70
Explanations to the figures: For simplified wave analysis, the simplest type of wave is used in the form of a zigzag, combining 3 parts (A; B; C). Of these waves, all kinds of correction are composed and most of the impulses. At each time frame, the last, incomplete wave is analyzed.
The areas marked on the graphs are indicated by the calculation areas, where the probability of a change in the direction of motion is significantly increased. Arrows indicate the wave counting according to the technique used by the author. The solid background of the arrows indicates the structure formed, the dotted one indicates the expected wave motion.
Attention: The wave algorithm does not take into account the duration of the tool movements in time. The forecast is not a trading signal! To conduct a trade transaction, you need to confirm the signals of your trading systems.
InstaForex analytical reviews will make you fully aware of market trends! Being an InstaForex client, you are provided with a large number of free services for efficient trading.

