 Stay
Stay 
Trading Conditions
Products
Tools


The rising wave of the British pound major pair on the chart sets the main direction of the price trend, since the beginning of last year. Its wave level significantly exceeds the correction size of the previous downward motion, comparing it to its potential. Analysis of the highest time frame of the instrument shows that this section begins the final phase in the long-term bullish wave model.
Due to the impulsive nature of the instrument's movement over the past year, there is no correction in its classical understanding on the graph. They have an exceptionally hidden character, forming an irregular type of wave designs. The last one counts from January and has not yet been completed. Calculating the potential for a highly possible decline indicates the probability of the pair in moving down towards the lower support zone.
Next week, the expected vector of the main movement will have a bearish policy.
Boundaries of resistance zones:
- 1.4000 / 1.4050
Boundaries of support zones:
- 1.3880 / 1.3830
- 1.3630 / 1.3580
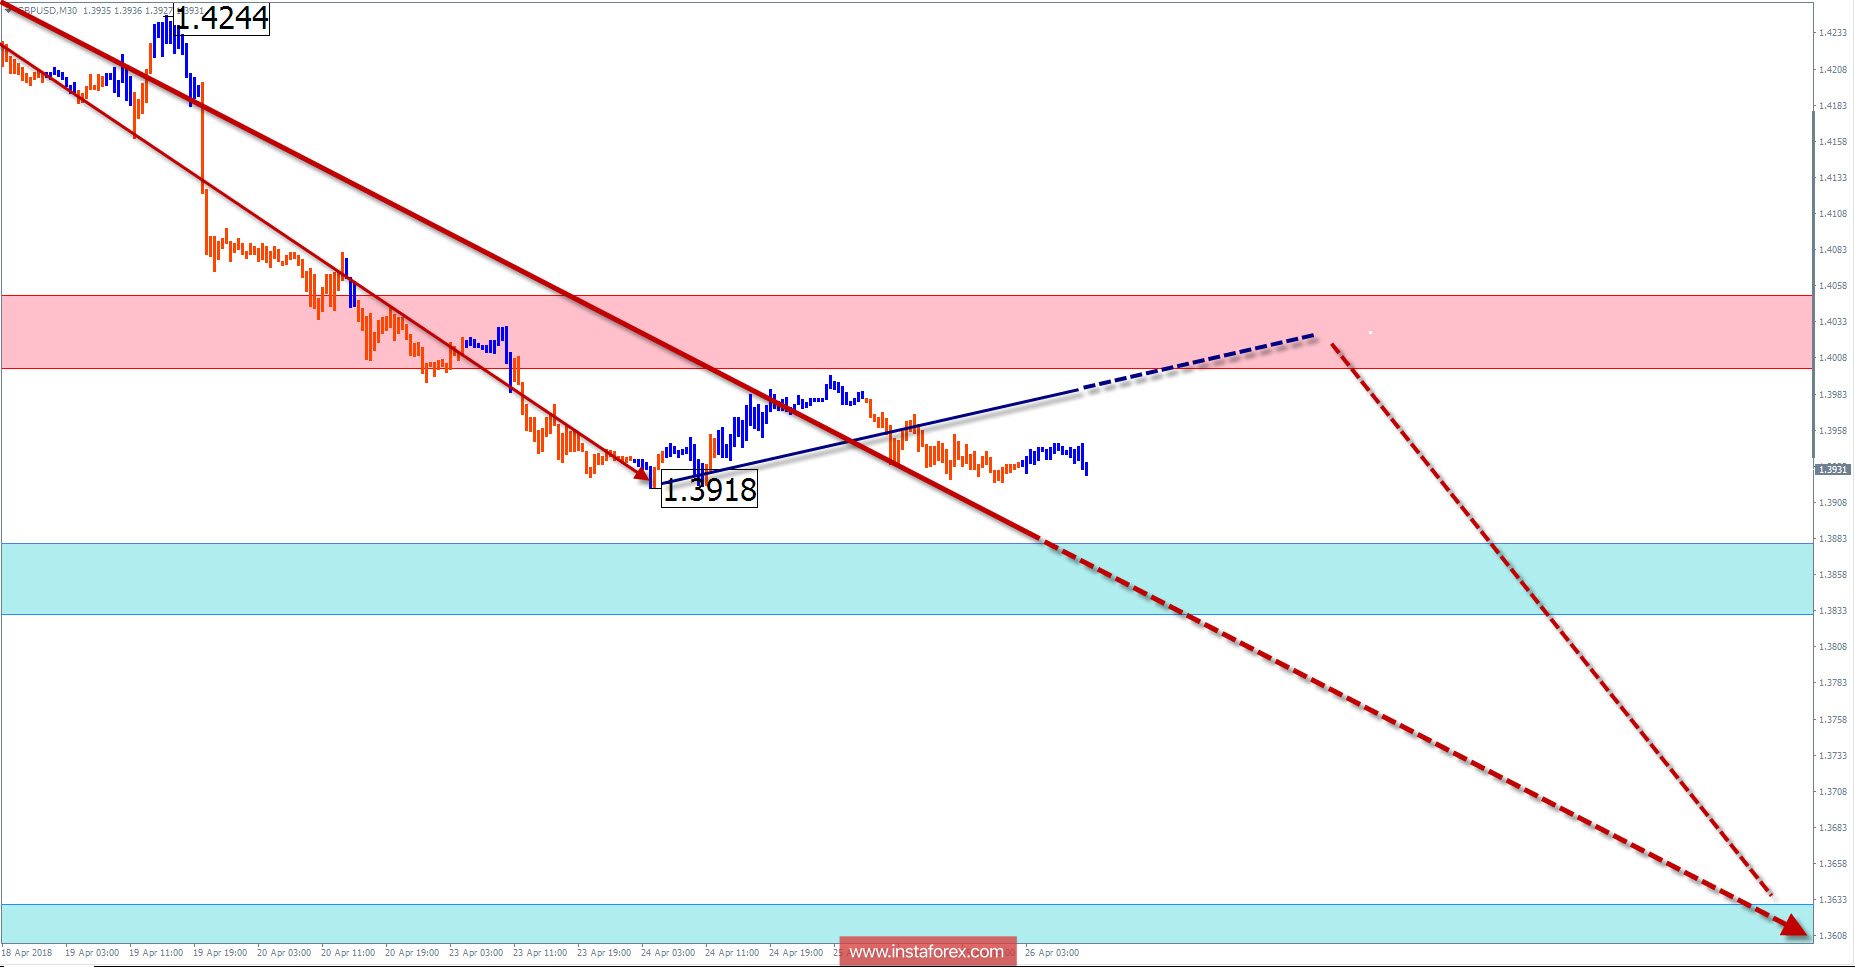
Explanations of the figures:
For simplified wave analysis, a simple waveform is used that combines 3 parts namely A, B, and C. All types of correction are created and most of the impulses can be found in these waves. Every time frame is considered and the last incomplete wave is analyzed.
The areas marked on the graphs indicate the probability of a change in the direction of motion has significantly increased as calculated in the areas. Arrows indicate the wave counting following the technique used by the author. A solid background of the arrows signifying the structure has been formed while the dotted one means the expected wave motion.
Attention: The wave algorithm does not take into account the duration of the movement of tools in time. The forecast is not a trading signal! To conduct a bargain, you need to confirm the signals used by your trading systems.
InstaForex analytical reviews will make you fully aware of market trends! Being an InstaForex client, you are provided with a large number of free services for efficient trading.

