 Stay
Stay 
Trading Conditions
Products
Tools


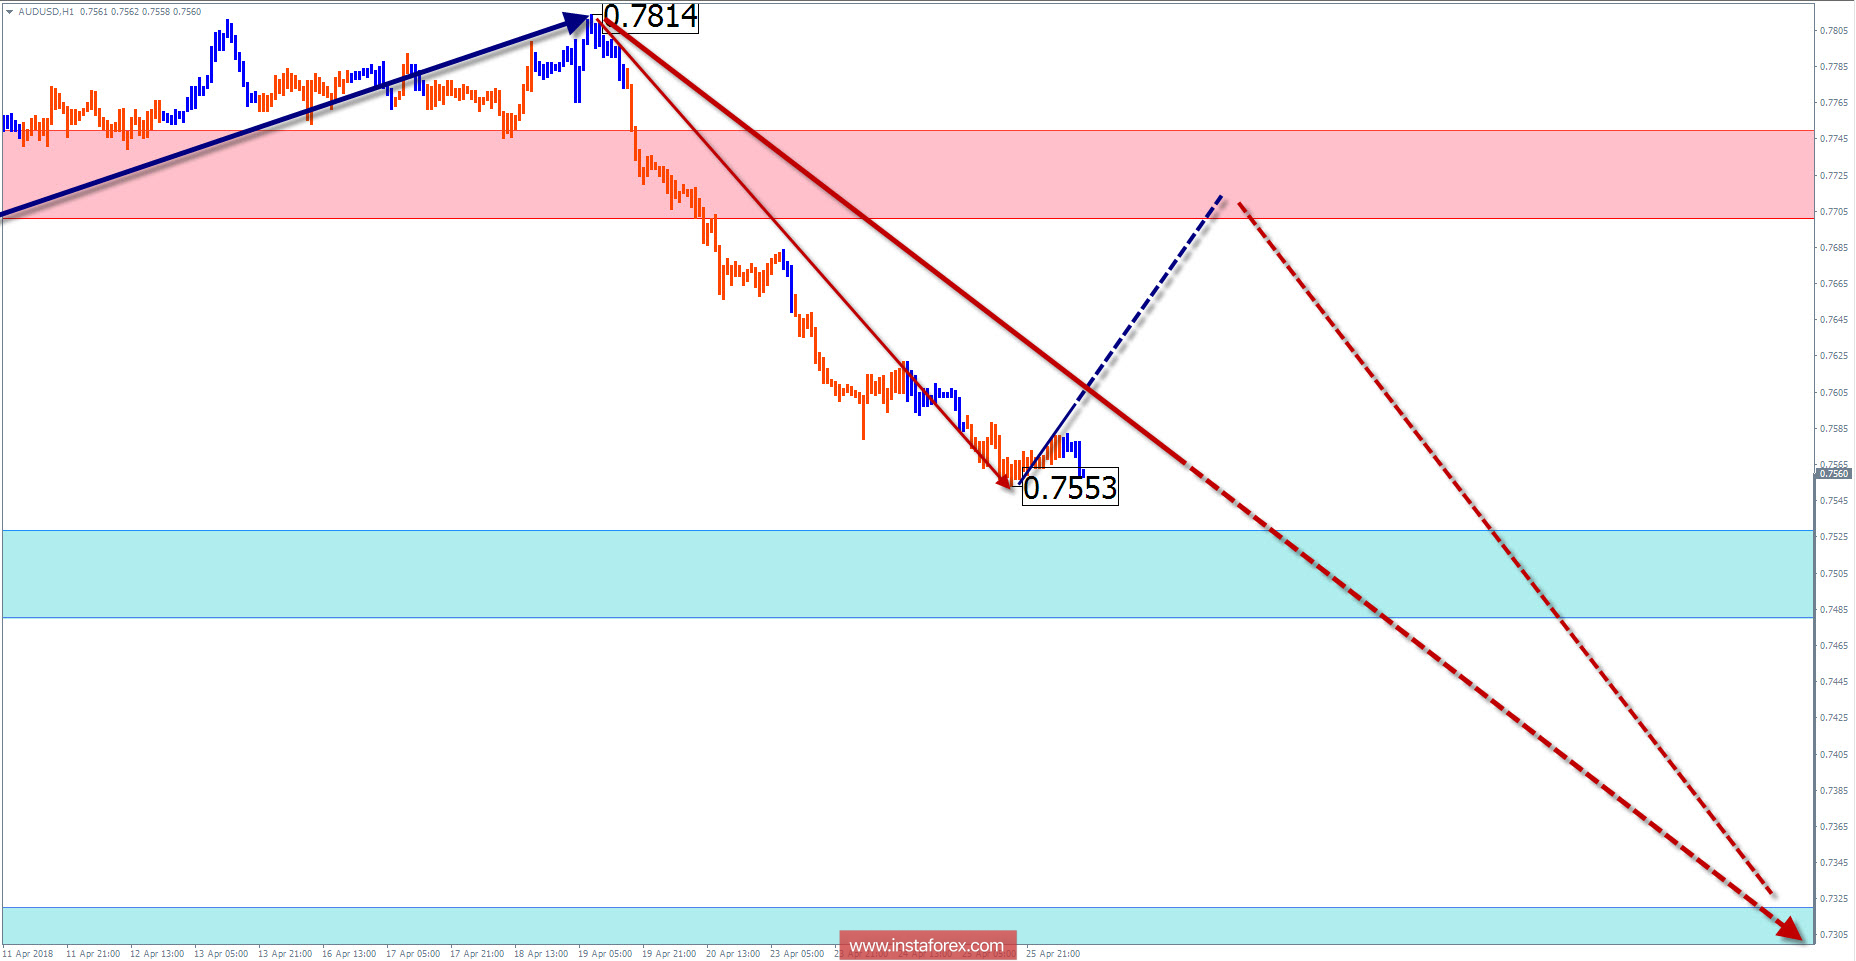
Beginning from the end of January, the downward wave of the main pair of the Australian dollar continues to set the trend rate. In the wave structure of a larger model, this section completes the correctional phase of motion. Starting from the middle of last year, the bearish wave has the appearance of an expanding triangle. The preliminary calculation of the target area as the upper limit of the potential reversal zone indicates the middle of the 74th price figure.
The general mood of the movement for the upcoming week is expected to be bearish. In the coming days, a short-term price rise to the levels of the calculated resistance zone is possible. The breakthrough of its upper limit is unlikely.
The boundaries of resistance zones:
- 0.7700 / 0.7750
The boundaries of support zones:
- 0.7530 / 0.7480
- 0.7320 / 0.7270
Explanations to the figures: For simplified wave analysis, the simplest type of wave is used in the form of a zigzag, combining 3 parts (A; B; C). Of these waves, all kinds of correction are composed and most of the impulses. At each time frame, the last, incomplete wave is analyzed.
The areas marked on the graphs are indicated by the calculation areas, where the probability of a change in the direction of motion is significantly increased. Arrows indicate the wave counting according to the technique used by the author. The solid background of the arrows indicates the structure formed, the dotted one indicates the expected wave motion.
Attention: The wave algorithm does not take into account the duration of the tool movements in time. The forecast is not a trading signal! To conduct a trade transaction, you need to confirm the signals of your trading systems.
InstaForex analytical reviews will make you fully aware of market trends! Being an InstaForex client, you are provided with a large number of free services for efficient trading.


