 Stay
Stay 
Trading Conditions
Products
Tools


Counter fluctuations in the US currency exchange rate in previous years are explained by the algorithm of the emerging correctional wave. It formed an expanding triangle, identified by the classical wave theory as an "expanded flat". Earlier this year, the general proportions of the wave have already formed. The minimum required extension level is reached. Nevertheless, the structure analysis indicates its incompleteness which gives grounds for waiting for the continuation of the current trend.
Over the past three months, quotes have formed an upward rollback. The index values have already reached the level of probable completion. However, a fairly high probability of further upward extension to the next calculation zone remains. Then the reversal and rebound to the January levels of the dollar exchange rate will follow.
Boundaries of resistance zones:
- 92.50 / 92.70
- 91.20 / 91.40
Boundaries of support zones:
- 89.50 / 89.30
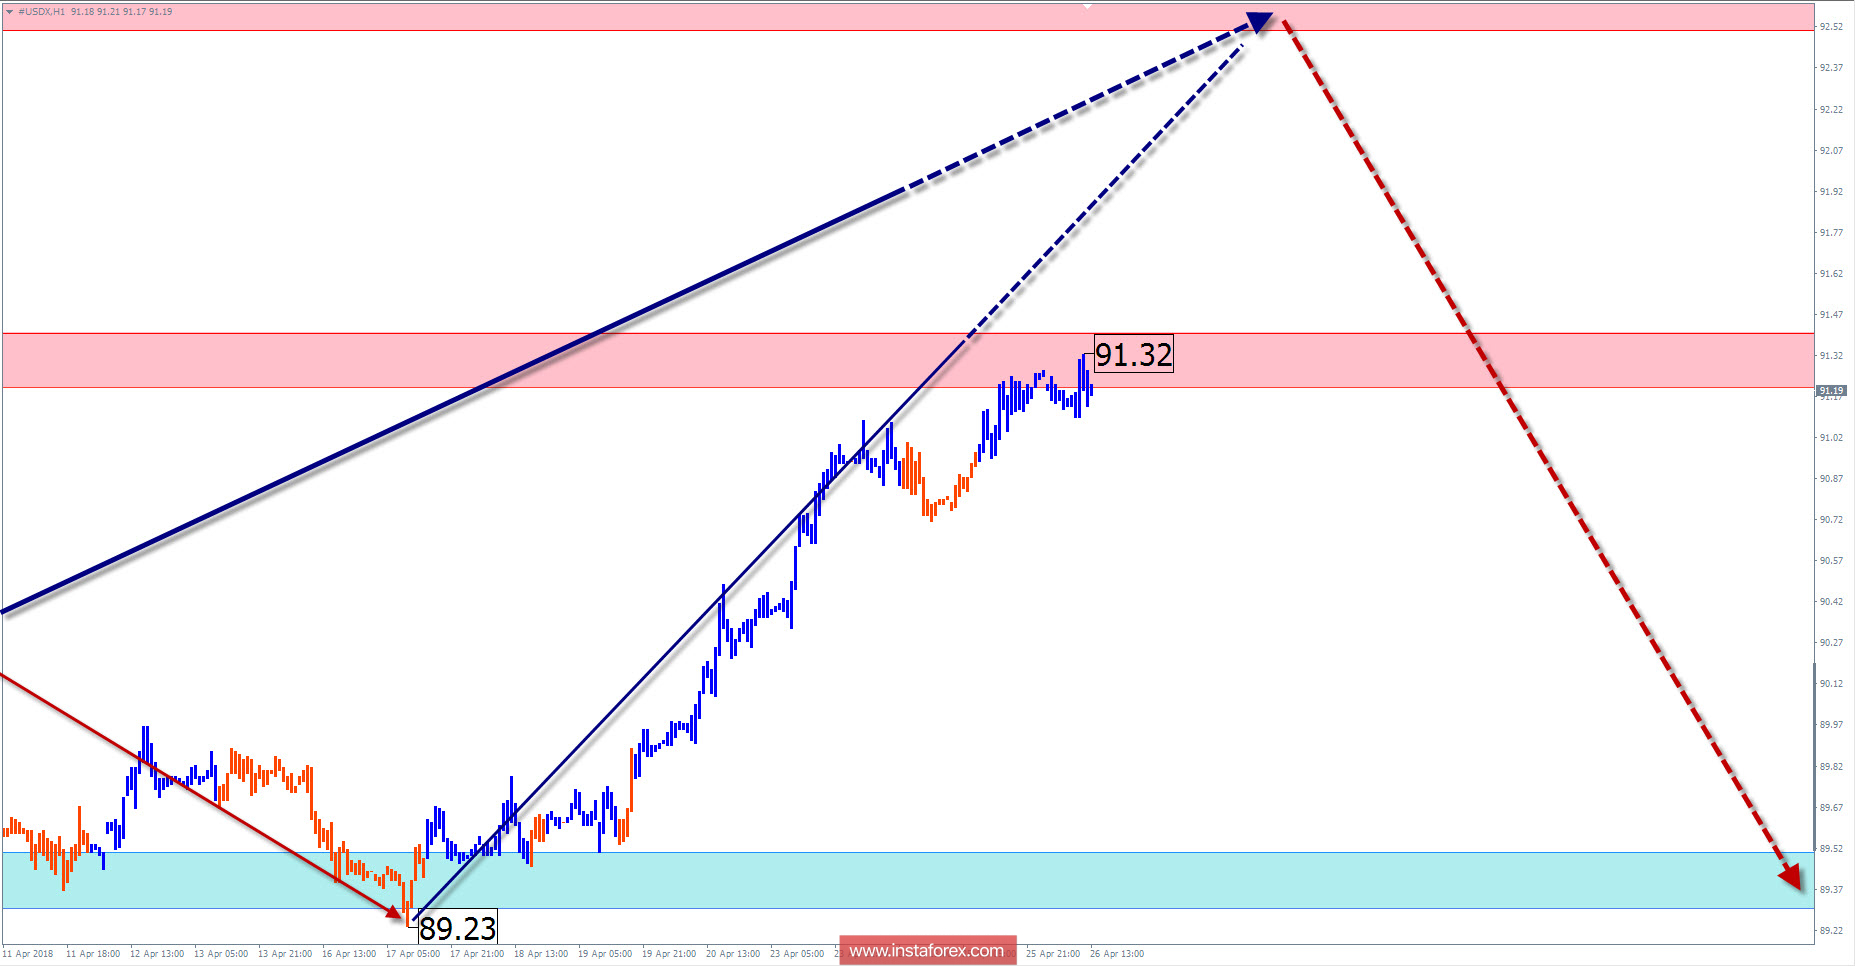
Explanations to the figures: For simplified wave analysis, the simplest type of wave is used in the form of a zigzag, combining 3 parts (A; B; C). Of these waves, all kinds of correction are composed and most of the impulses. At each time frame, the last, incomplete wave is analyzed.
The areas marked on the graphs are indicated by the calculation areas, where the probability of a change in the direction of motion is significantly increased. Arrows indicate the wave counting according to the technique used by the author. The solid background of the arrows indicates the structure formed, the dotted one indicates the expected wave motion.
Attention: The wave algorithm does not take into account the duration of the tool movements in time. The forecast is not a trading signal! To conduct a trade transaction, you need to confirm the signals of your trading systems.
InstaForex analytical reviews will make you fully aware of market trends! Being an InstaForex client, you are provided with a large number of free services for efficient trading.


