 Stay
Stay 
Trading Conditions
Products
Tools


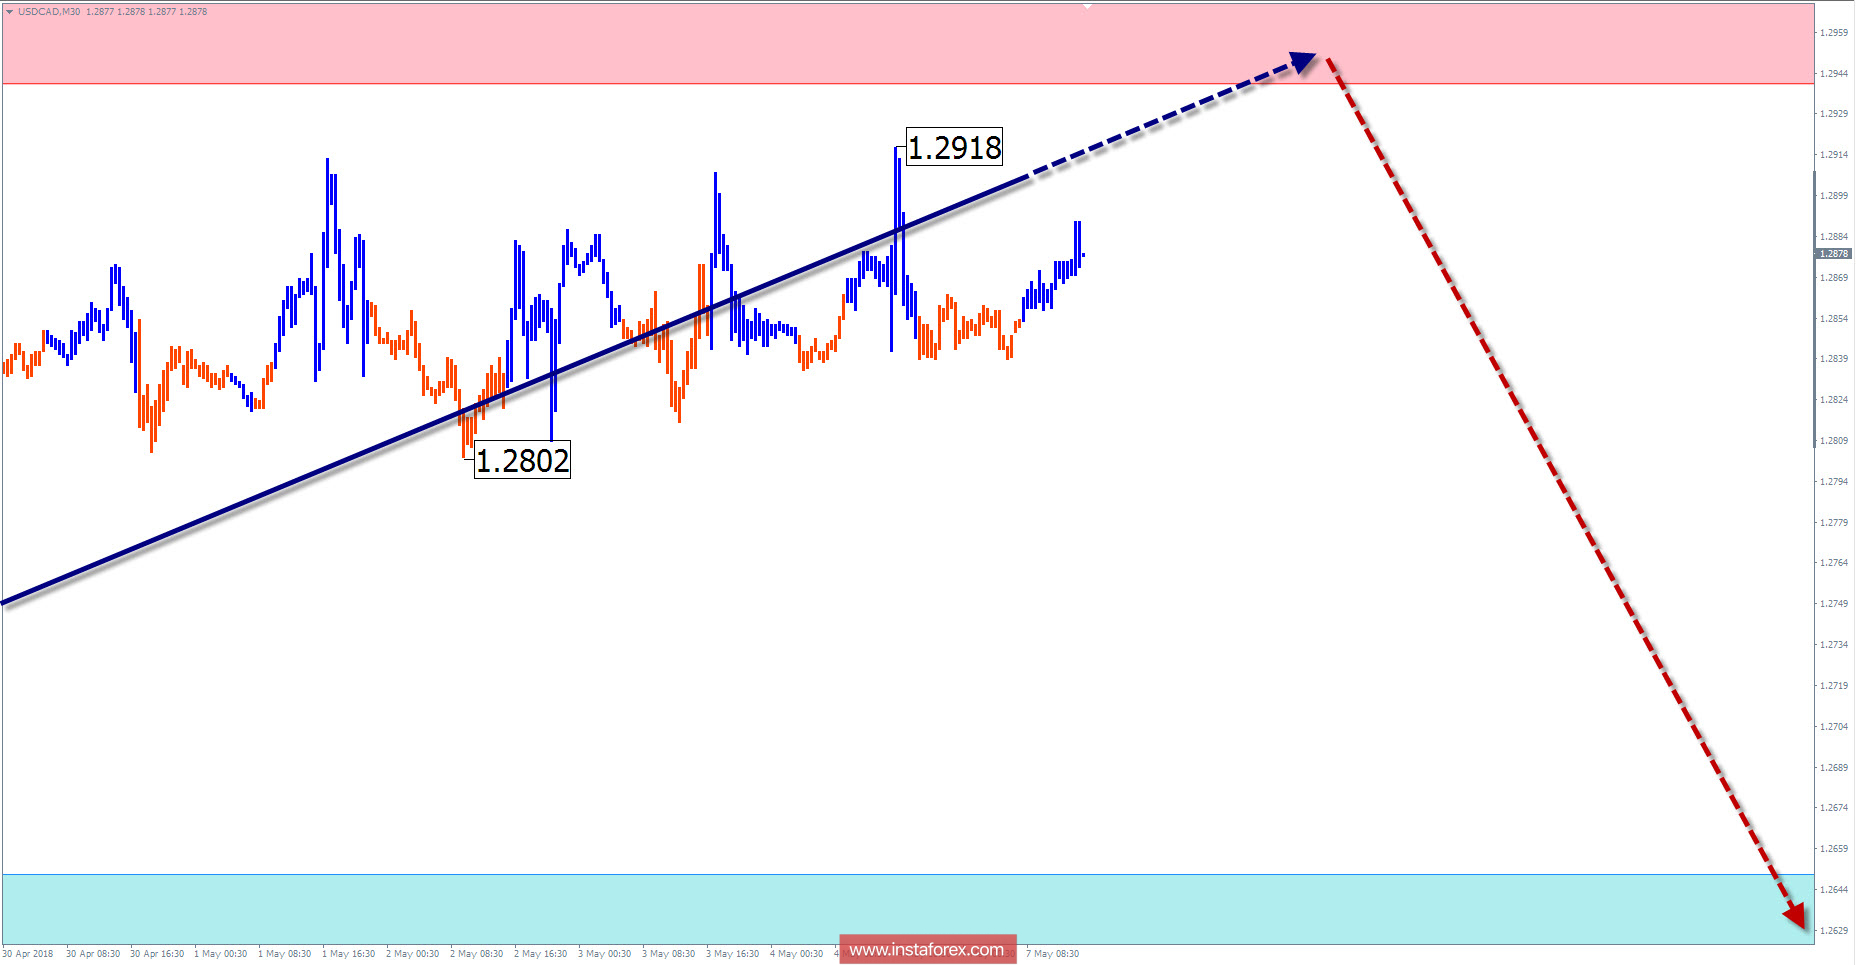
Since September last year, price movements of the main pair of Canadian currency have formed a wide upward corridor, in about 6 price figures. All this plot of the plot takes the place of the final part of the correction of the descending wave of a larger scale.
Since March 19, the price has made another turn down. Beginning in April, the rise formed a corrective pullback, which by some indications is close to its completion.
The pair will complete the ascending section next week. The most likely turning point is the calculated resistance zone. In this case, a short-term puncture of its upper limit can not be ruled out. Further, a change in the course of traffic is expected. The price move down towards the end of the week will limit the support area.
The boundaries of resistance zones:
- 1.2940 / 1.2990
The boundaries of support zones:
- 1.2650 / 1.2600
Explanations to the figures: For simplified wave analysis, the simplest type of wave is used in the form of a zigzag, combining 3 parts (A; B; C). Of these waves, all kinds of correction are composed and most of the impulses. At each time frame, the last, incomplete wave is analyzed.
The areas marked on the graphs are indicated by the calculation areas, where the probability of a change in the direction of motion is significantly increased. Arrows indicate the wave counting according to the technique used by the author. The solid background of the arrows indicates the structure formed, the dotted one indicates the expected wave motion.
Attention: The wave algorithm does not take into account the duration of the tool movements in time. The forecast is not a trading signal! To conduct a trade transaction, you need to confirm the signals of your trading systems.
InstaForex analytical reviews will make you fully aware of market trends! Being an InstaForex client, you are provided with a large number of free services for efficient trading.

