 Stay
Stay 
Trading Conditions
Products
Tools


The period of the collapse of the gold exchange rate has remained in the past. The beginning of the weakening of the US dollar's positions triggered a reverse trend in the market of interest in the reserve instrument.
The wave pattern shows an upward wave zigzag, which starts in December 2015. After a period of subsequent corrective recession, from the end of the next 2016 the price shows steady growth, although its rates are minimal.
The current year the gold rate met in the region of the control level at 1350 dollars per troy ounce. There was formed a strong counter zone, along which the quotes of the pair are still plying. The current section of the chart formed a correction within the last part (C) of the main short-term wave.
In the coming week, it is worth waiting for the price to move in a narrow range between the settlement counter zones. In the coming days, a short-term rate increase is possible, after which the decline will continue.
The boundaries of resistance zones:
- 1320.0 / 1330.0
The boundaries of support zones:
- 1295.0 / 1285.0
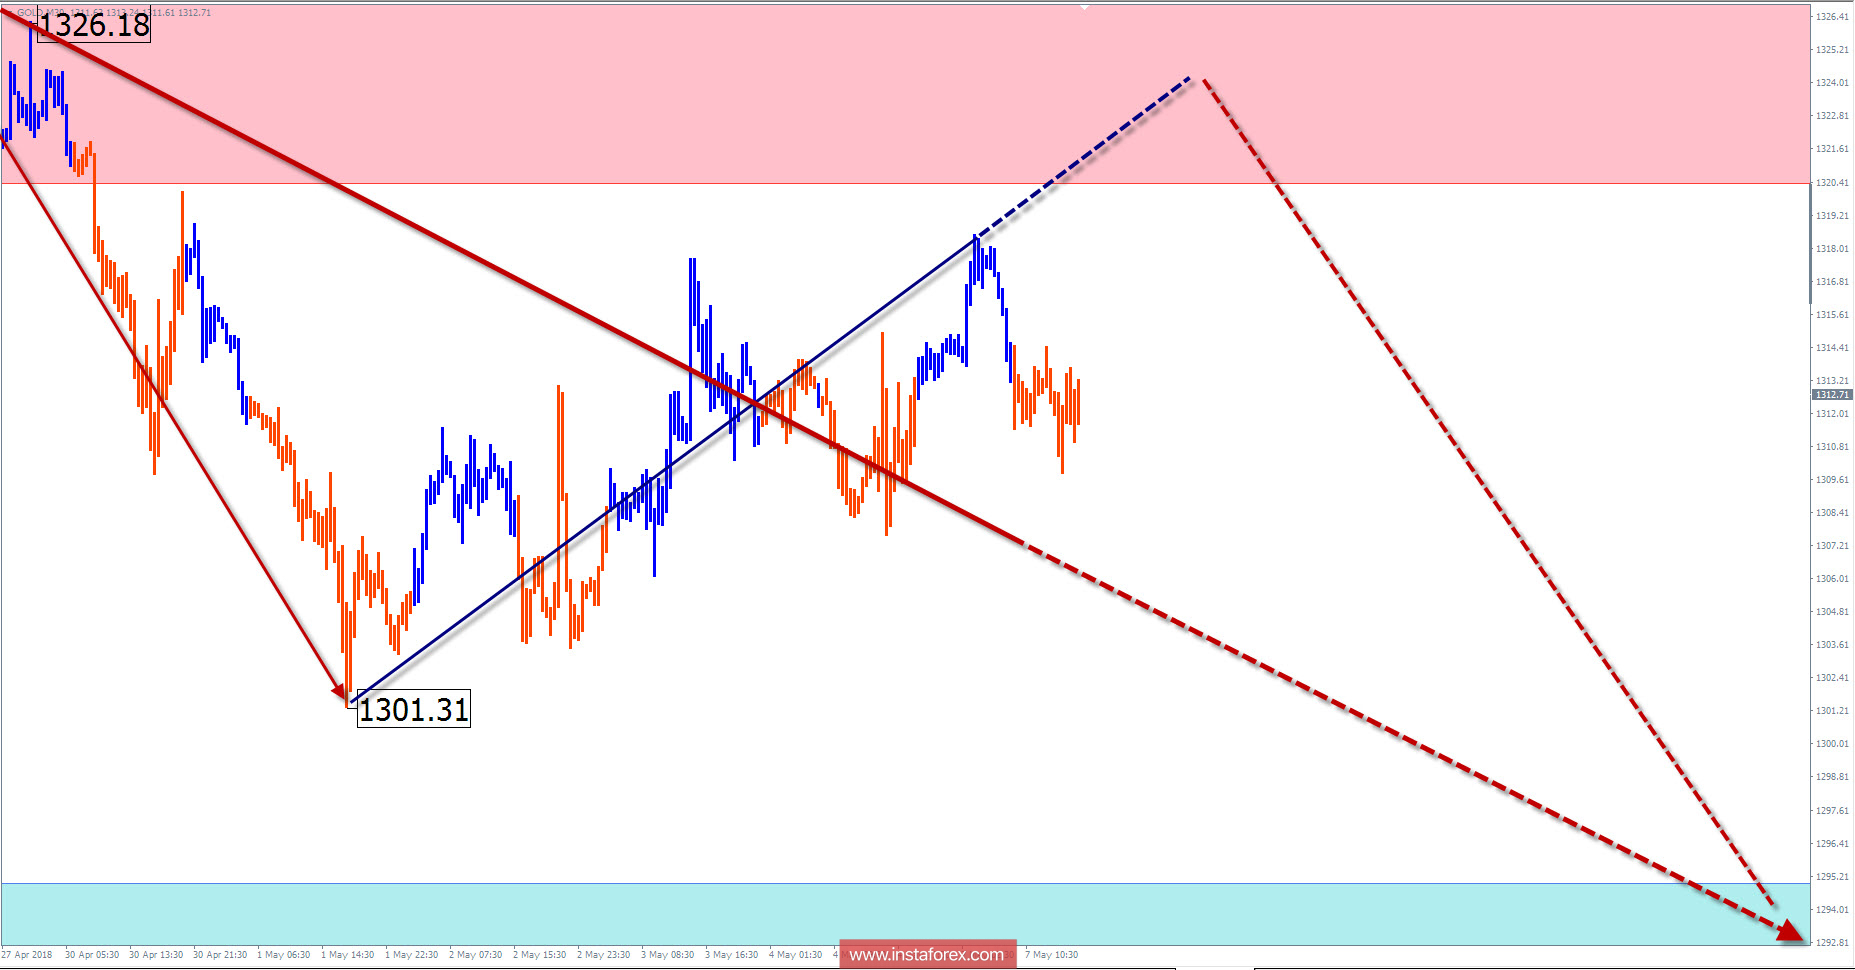
Explanations to the figures: For simplified wave analysis, the simplest type of wave is used in the form of a zigzag, combining 3 parts (A; B; C). Of these waves, all kinds of correction are composed and most of the impulses. At each time frame, the last, incomplete wave is analyzed.
The areas marked on the graphs are indicated by the calculation areas, where the probability of a change in the direction of motion is significantly increased. Arrows indicate the wave counting according to the technique used by the author. The solid background of the arrows indicates the structure formed, the dotted one indicates the expected wave motion.
Attention: The wave algorithm does not take into account the duration of the tool movements in time. The forecast is not a trading signal! To conduct a trade transaction, you need to confirm the signals of your trading systems.
InstaForex analytical reviews will make you fully aware of market trends! Being an InstaForex client, you are provided with a large number of free services for efficient trading.

