 Stay
Stay 
Trading Conditions
Products
Tools


In the activity for the past two years, the rising trend of the major "Aussie" crossed the long-term decline in quotations. The high wave potential of this movement makes it possible to classify it as the initial stage of a change in the long-term trend. Before this, the structure of the current wave must be completely completed.
Since September last year, the descending wave has formed a distinct descending zigzag, the final part (C) of which has not yet been completed. The support zone is the upper boundary of the nearest target area. At the same time, the probability of continuing the decline is quite high. With the developed waveform, the price will return to the launching point or even further than it occurs often during correction.
In the next couple of days, one can expect a potential for a short-term price increase but not exceeding the resistance zone. Then, there will be a return to the main course and the decline will continue.
Boundaries of resistance zones:
- 0.7630 / 0.7680
Boundaries of support zones:
- 0.7320 / 0.7270
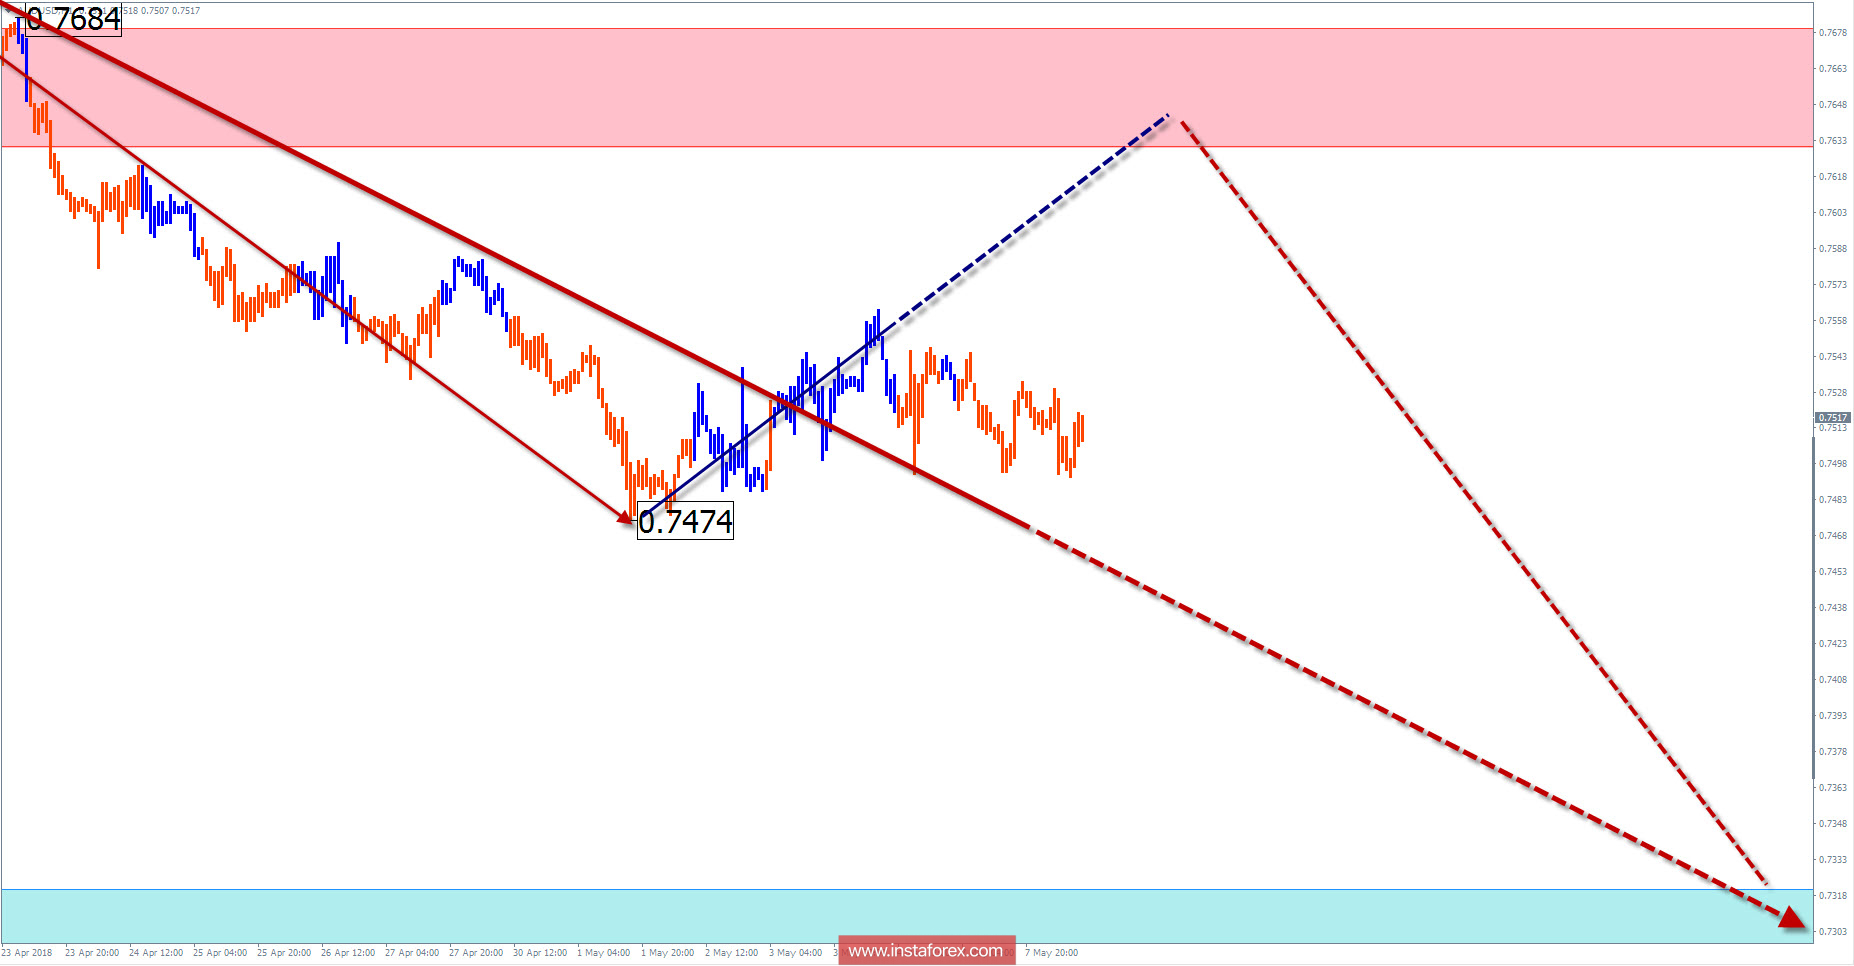
Explanations of the figures:
For simplified wave analysis, a simple waveform is used that combines 3 parts namely A, B, and C. All types of correction are created and most of the impulses can be found in these waves. Every time frame is considered and the last incomplete wave is analyzed.
The areas marked on the graphs indicate the probability of a change in the direction of motion has significantly increased as calculated in the areas. Arrows indicate the wave counting following the technique used by the author. A solid background of the arrows signifying the structure has been formed while the dotted one means the expected wave motion.
Attention: The wave algorithm does not take into account the duration of the movement of tools in time. The forecast is not a trading signal! To conduct a bargain, you need to confirm the signals used by your trading systems.
InstaForex analytical reviews will make you fully aware of market trends! Being an InstaForex client, you are provided with a large number of free services for efficient trading.

