 Stay
Stay 
Trading Conditions
Products
Tools


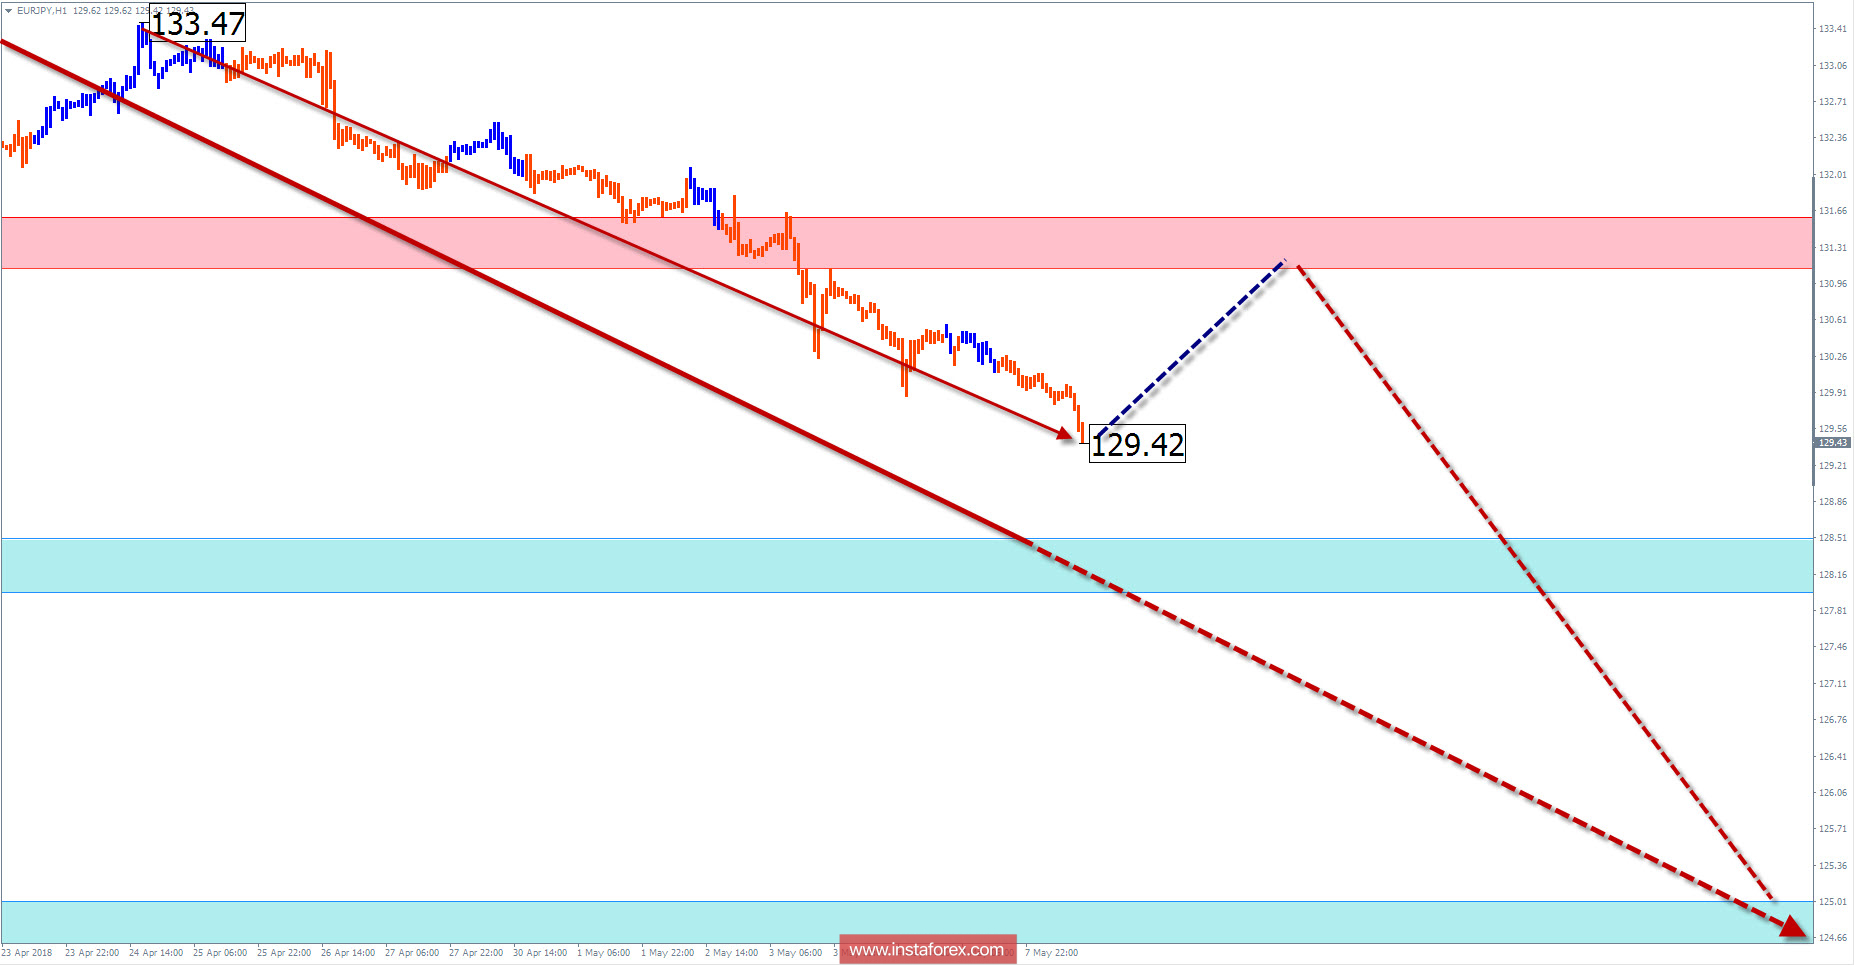
The rising wave of the instrument's trend that began in June 2016 reached the phase of active correction. The structure of the wave has not yet been completed, which implies its continuation after the current decline. The sweep of the downward stroke causes an incorrect appearance of the corrective part of the wave which rarely exceeds the minimum required level of elongation of pulse waves. The estimated target zone is located in the region of the 125th price figure. The potential for immediate support is also sufficient for the likely end of the decline.
In the next trading sessions, it is possible to exclude a lateral flat or a short-term rise to resistance levels. The main vector of the movement is expected to be bearish. If the closest support does not keep the price, the target stop zone is not expected.
Boundaries of resistance zones:
- 131.10 / 131.60
Boundaries of support zones:
- 128.50 / 128.00
- 125.00 / 124.50
Explanations of the figures:
For simplified wave analysis, a simple waveform is used that combines 3 parts namely A, B, and C. All types of correction are created and most of the impulses can be found in these waves. Every time frame is considered and the last incomplete wave is analyzed.
The areas marked on the graphs indicate the probability of a change in the direction of motion has significantly increased as calculated in the areas. Arrows indicate the wave counting following the technique used by the author. A solid background of the arrows signifying the structure has been formed while the dotted one means the expected wave motion.
Attention: The wave algorithm does not take into account the duration of the movement of tools in time. The forecast is not a trading signal! To conduct a bargain, you need to confirm the signals used by your trading systems.
InstaForex analytical reviews will make you fully aware of market trends! Being an InstaForex client, you are provided with a large number of free services for efficient trading.


