 Stay
Stay 
Trading Conditions
Products
Tools


On the weekly scale index since March 2015, a descending correction "expanded flat" model was developed. In February this year, the dollar quotations reached the upper limit of the strong counter zone. The completion of the graph formation led many supporters of classical wave analysis to began betting on the trend reversal of the dollar.
The questioned wave analysis indicates the incompleteness of the current bearish model. In the recent months, an upward rollback has limited potential and insufficient to form a reversal structure.
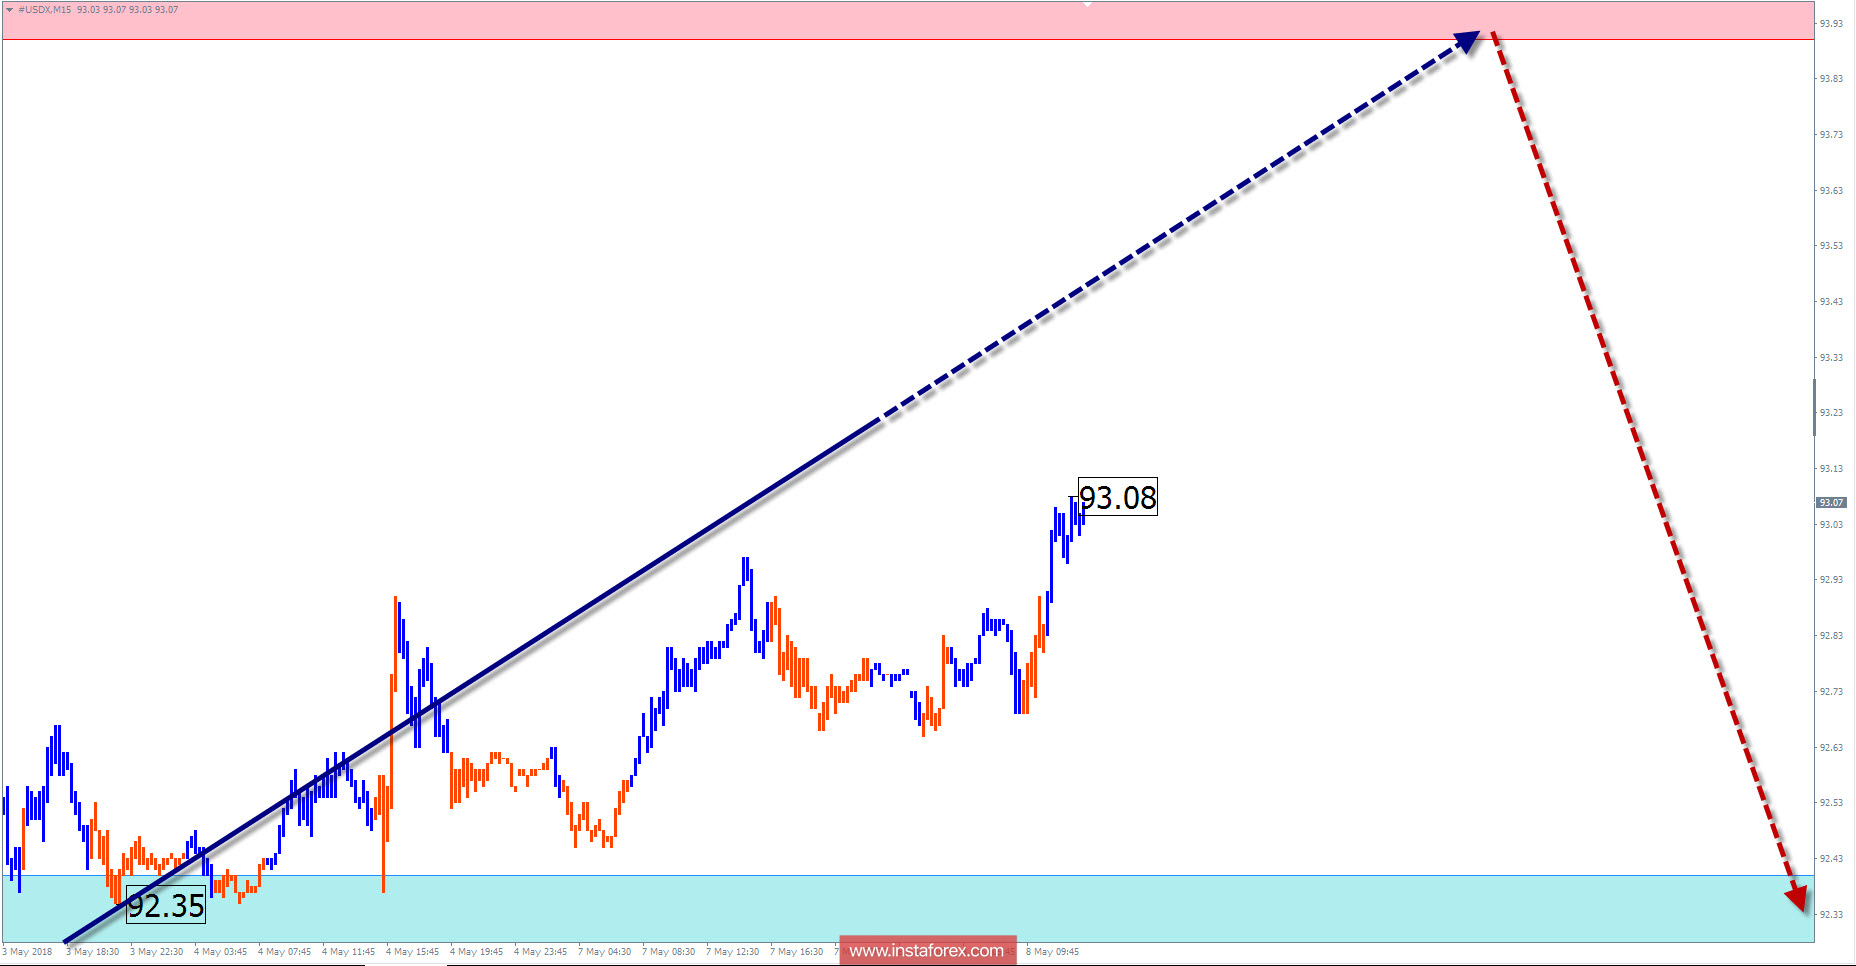
The calculated resistance zone is at the lower boundary of the most probable end of the lift. Breakthrough of its top line is unlikely. There is a higher chance of changing the course and the beginning of the decline in the index. The course of the dollar down can take an avalanche character
Boundaries of resistance zones:
- 93.90 / 94.10
Boundaries of support zones:
- 92.40 / 92.20
Explanations to the figures: For simplified wave analysis, the simplest type of wave is used in the form of a zigzag, combining 3 parts (A; B; C). Of these waves, all kinds of correction are composed and most of the impulses. At each time frame, the last, incomplete wave is analyzed.
The areas marked on the graphs are indicated by the calculation areas, where the probability of a change in the direction of motion is significantly increased. Arrows indicate the wave counting according to the technique used by the author. The solid background of the arrows indicates the structure formed, the dotted one indicates the expected wave motion.
Attention: The wave algorithm does not take into account the duration of the tool movements in time. The forecast is not a trading signal! To conduct a trade transaction, you need to confirm the signals of your trading systems.
* The presented market analysis is informative and does not constitute a guide to the transaction.
InstaForex analytical reviews will make you fully aware of market trends! Being an InstaForex client, you are provided with a large number of free services for efficient trading.


