 Stay
Stay 
Trading Conditions
Products
Tools


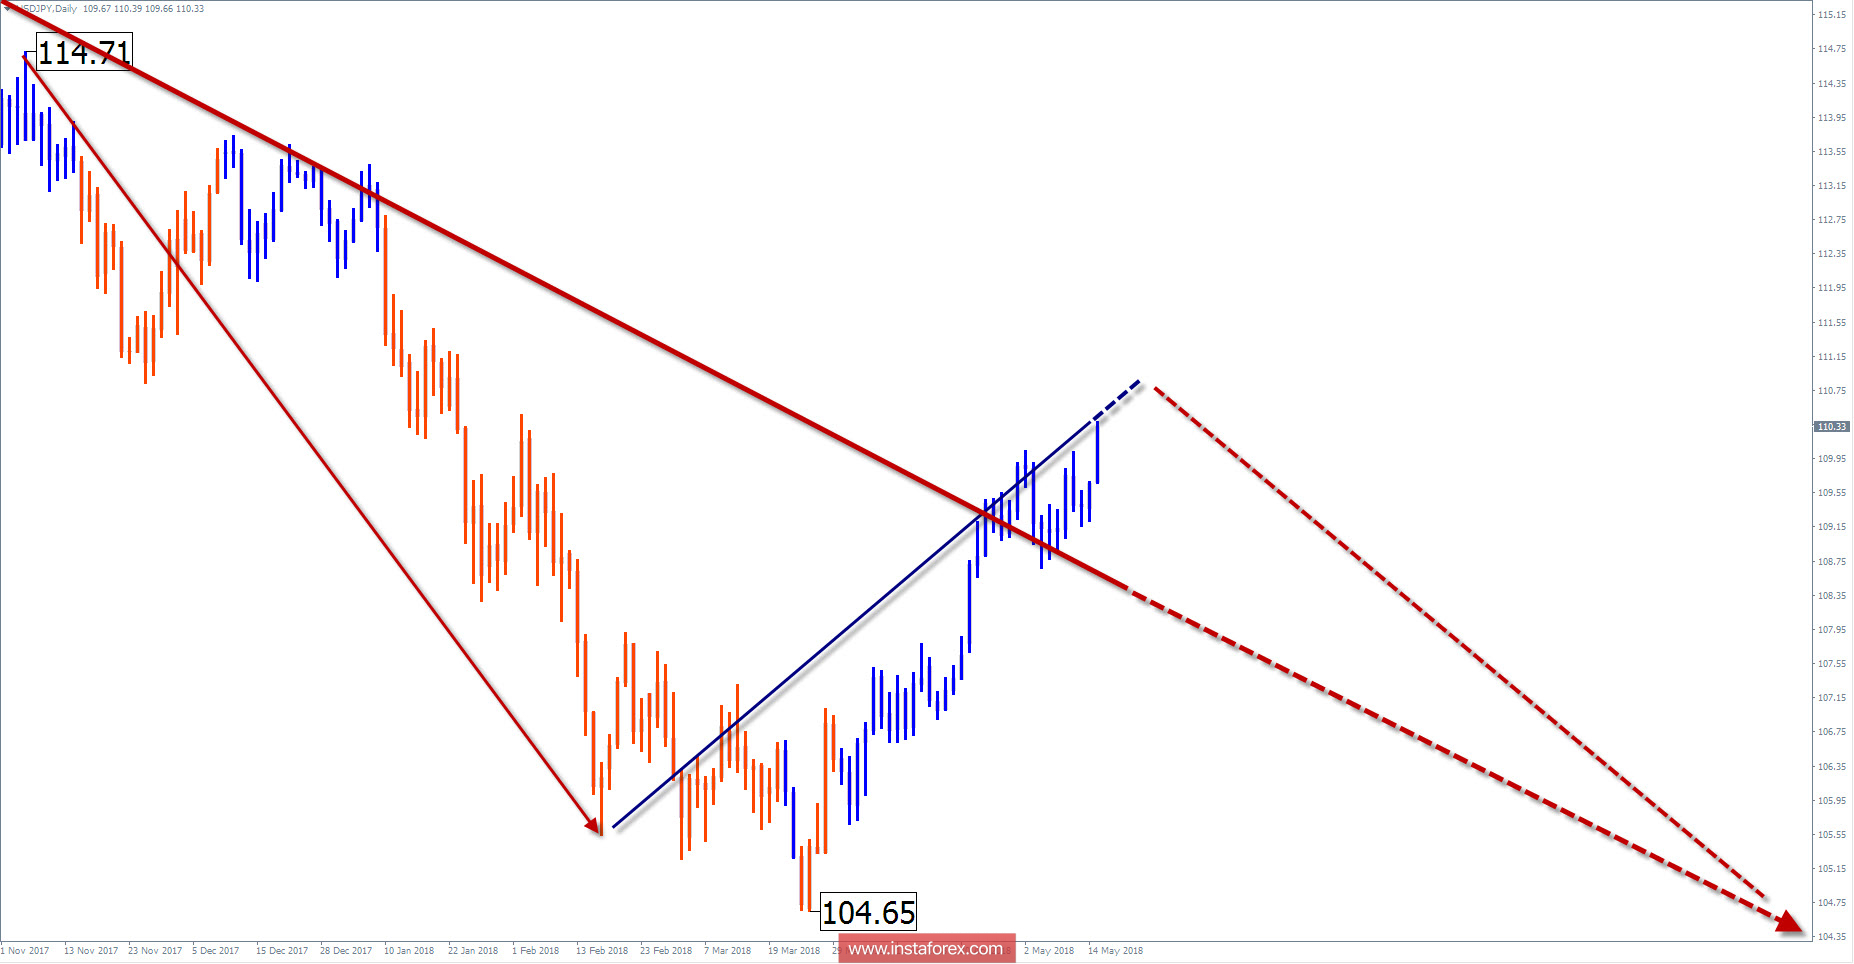
Wave picture of the D1 chart:
On the daily scale of the chart of Japanese major currency pair, the priority is in the downtrend. The last of its site started in November 2017 as not yet been completed. The minimum proportions of the parts of the wave are reached, but there are still no signals to change the course.
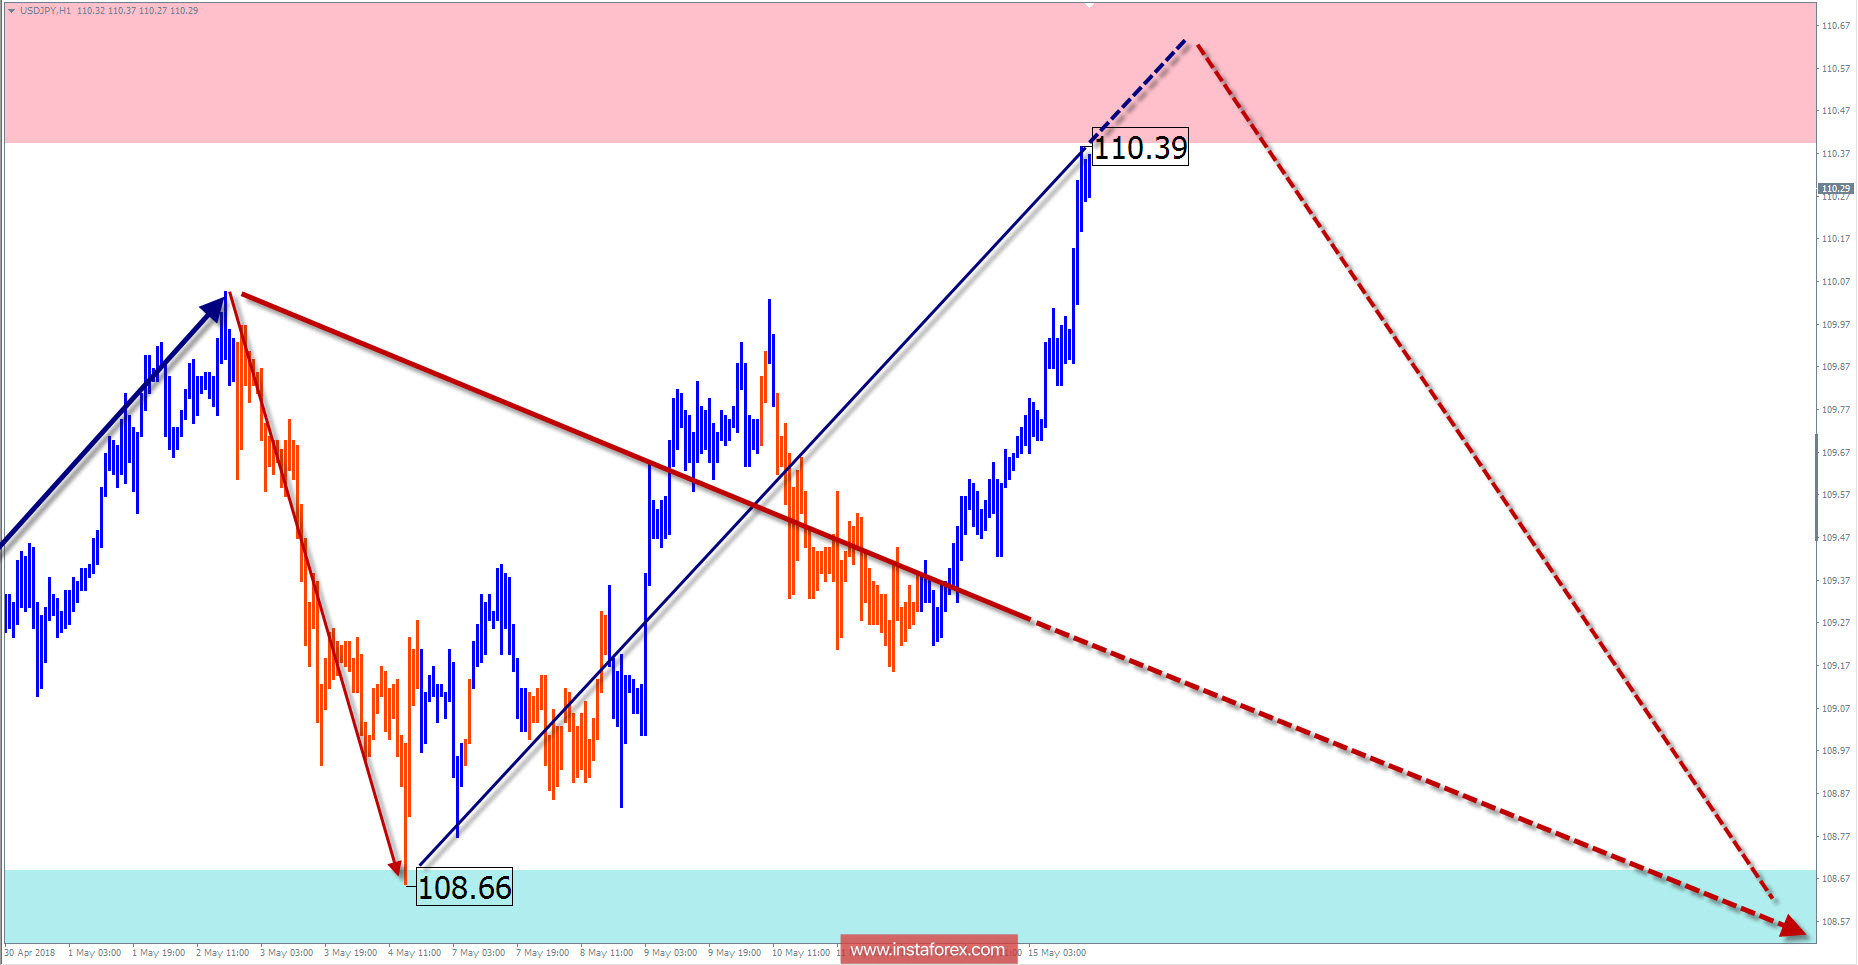
The wave pattern of the H1 graph:
The last wave on this scale is ascending. Its structure has the wrong appearance, with the stretching of the middle part down. The potential for a change in exchange rate does not come from the wave. Quotations reached the lower limit of the zone of a likely reversal.
The wave pattern of the M15 chart:
Counter-correction is formed on the chart from the beginning of May. The wave is not complete. Judging by the type of structure, the wave will continue to form in the lateral plane.
Recommended trading strategy:
Trading large periods of the schedule, you must wait until the current bullish wave is completely over. Supporters of a shorter-term style are better off in refraining from trading. There is little potential for purchases and there are no any signals for selling yet.
Resistance zones:
- 110.40 / 110.90
Support zones:
- 108.70 / 108.20
Explanations to the figures:
A simplified wave analysis uses a simple waveform, in the form of a 3-part zigzag (ABC). The last incomplete wave for every timeframe is analyzed. Zones show the calculated areas with the greatest probability of a turn.
Arrows indicate the counting of wave according to the technique used by the author. The solid background shows the generated structure and the dotted exhibits the expected wave motion.
Attention: The wave algorithm does not take into account the duration of the tool movements in time. To conduct a trade transaction, you need to confirm the signals used by your trading systems.
InstaForex analytical reviews will make you fully aware of market trends! Being an InstaForex client, you are provided with a large number of free services for efficient trading.


