 Stay
Stay 
Trading Conditions
Products
Tools


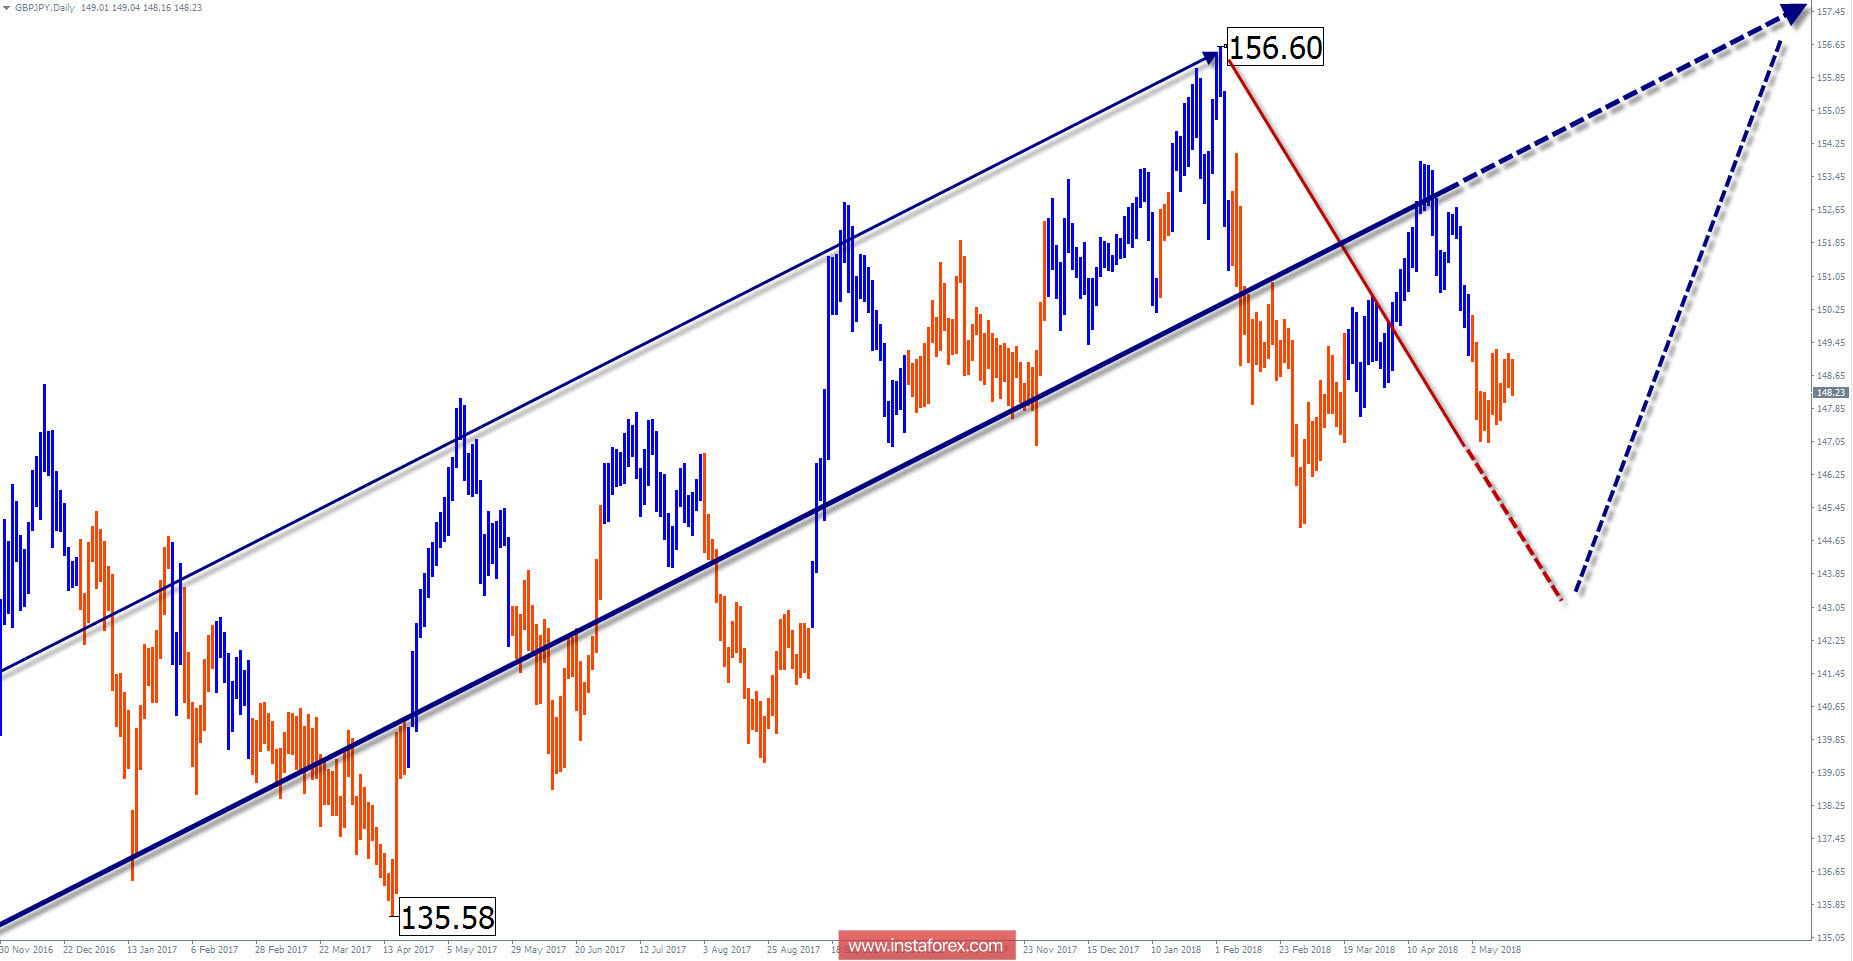
Wave picture of the chart D1:
The increasing rate of the GBp/JPY cross pair chart from October 2016 is set by the bullish wave of the instrument. The potential of this section exceeds the length of correction of the previous bearish trend. With a high probability, conditions are being prepared for changing the movement of the prevailing trend direction.
The wave pattern of the graph H1:
The bearish section of April 13 forms the final part (C) in the descending correction zigzag of the larger scale H4. The upper boundary of the target area is the distant support zone.
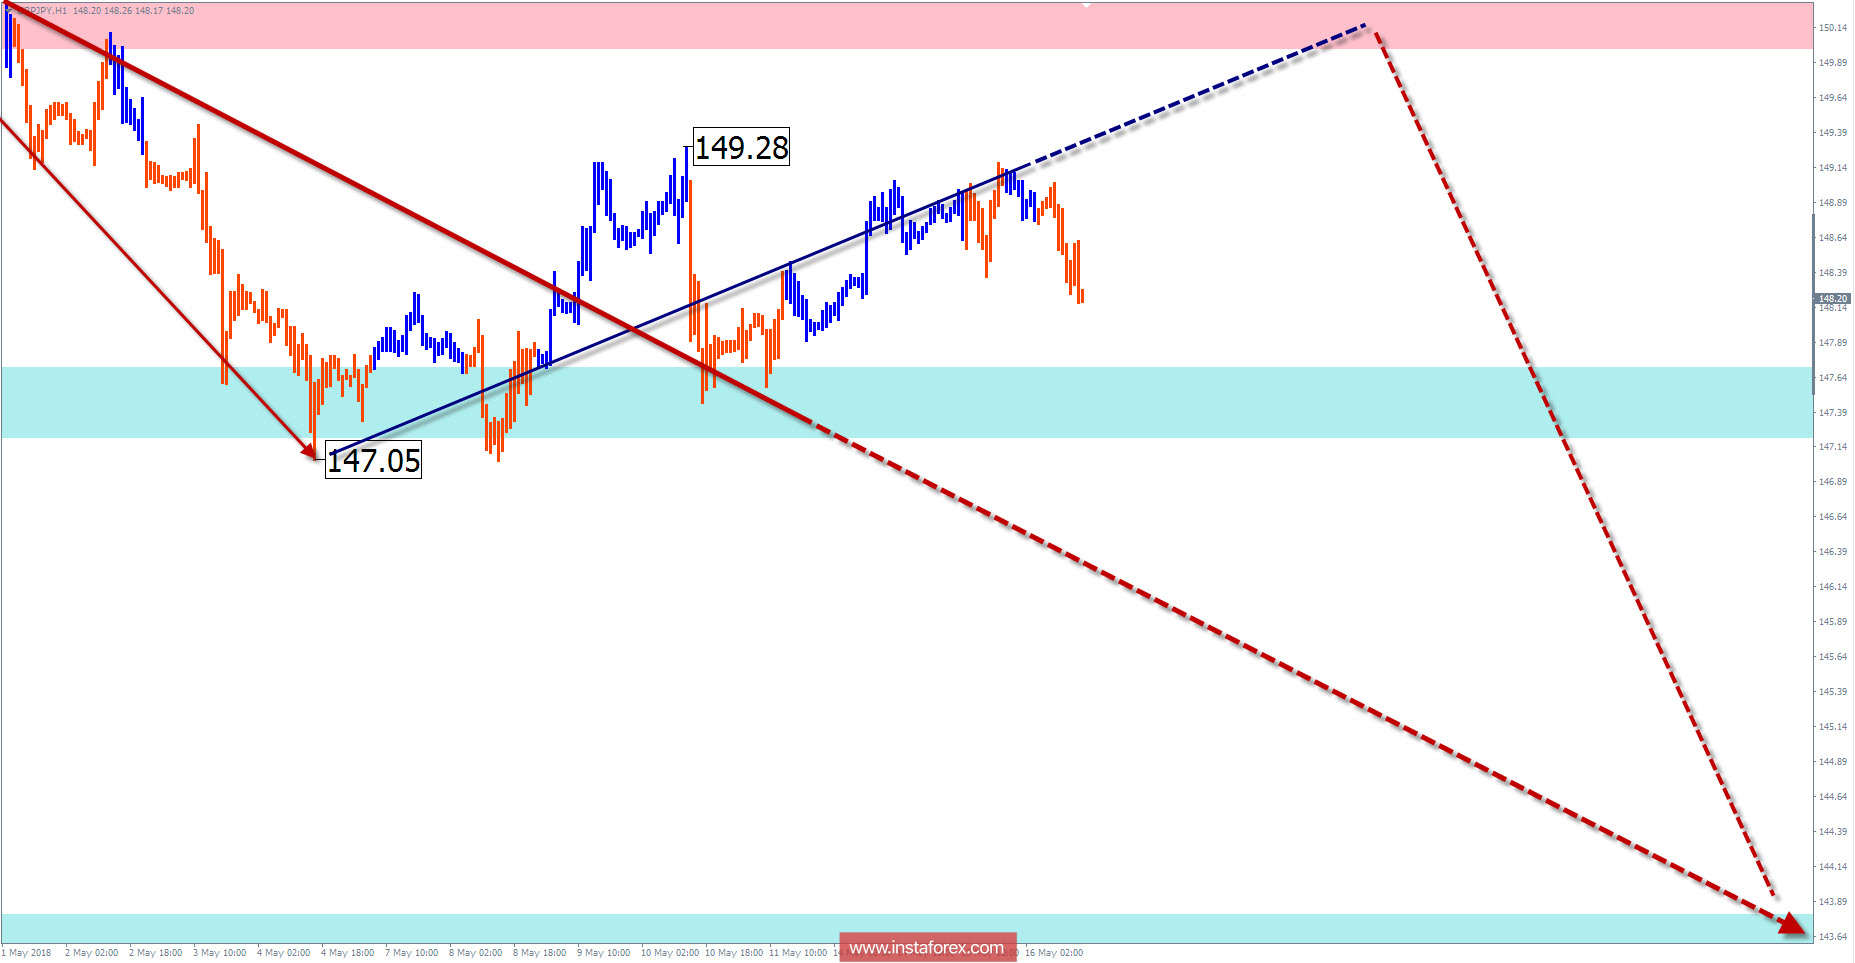
The wave pattern of the M15 chart:
In the context of the described wave above since May 4, the price has been adjusted upwards. Preliminary calculation of the goal allows you to expect for about 2 price figures up.
Recommended trading strategy:
Traders who trade in large areas of the schedule needs to wait for the completion of the downward correction. Intraday traders are advised to stay in the resistance zone to look for an entrance to sell the pair.
Resistance zones:
- 150.00 / 150.50
Support zones:
- 147.70 / 147.20
- 143.80 / 143.30
Explanations to the figures: Simplified wave analysis uses a simple waveform, in the form of a 3-part zigzag (ABC). At each time frame, the last incomplete wave is analyzed. Zones show the calculated areas with the greatest probability of a reversal.
Arrows indicate the wave counting according to the technique used by the author. The solid background shows the generated structure, dotted - the expected wave motion.
Attention: The wave algorithm does not take into account the duration of the tool movements in time. To conduct a trade transaction, you need confirmation signals from your trading systems!
* The presented market analysis is informative and does not constitute a guide to the transaction.
InstaForex analytical reviews will make you fully aware of market trends! Being an InstaForex client, you are provided with a large number of free services for efficient trading.


