 Stay
Stay 
Trading Conditions
Products
Tools


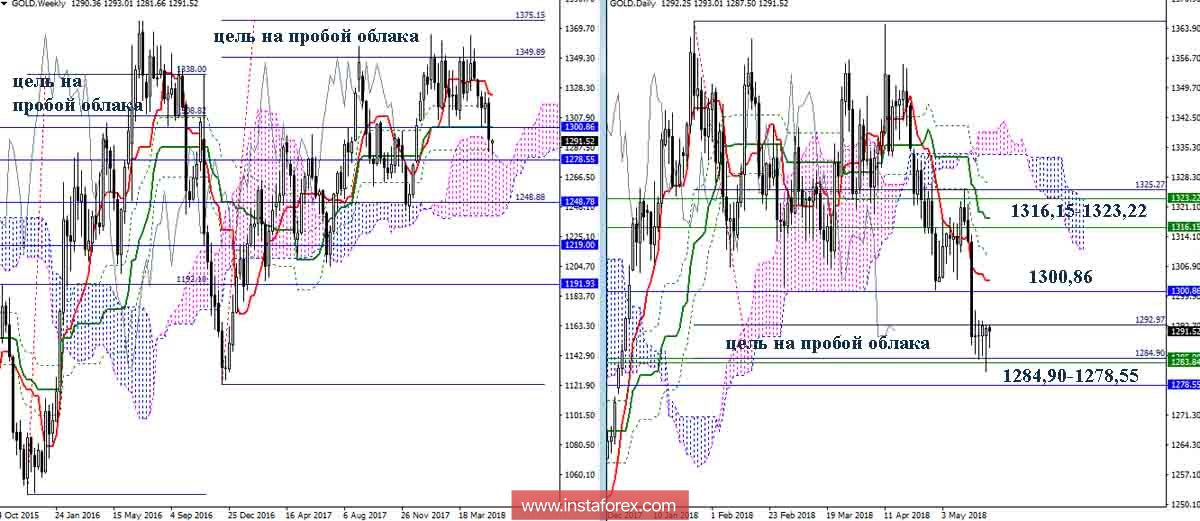
GOLD
The gold twice tried to go beyond the ascending goals to break the weekly cloud, but to no avail. To date, another decline has been made, which allowed gold to descend to the final boundary of the weekly gold cross while working out a daily downside target for the breakdown of the cloud (1284.90). The daily goal is now strengthened by the support of several timeframes - a week (Fibo Kijun 1285.57 + Senkou Span A 1283.84) and a monthly one (Fibo Kijun 1278.55). This zone (1284.90 - 1278.55) is the most important, its overcoming opens up new prospects for players to fall. The next landmark, in case of breakdown, will be the joint support zone, currently located at 1239.95 - 1248.78 (the lower boundary of the weekly cloud + the monthly Kijun). But it should be noted that the strength of the supported supports (1284.90 - 1278.55) and daytime inhibition in the current situation make the development of day-to-day upward correction quite a priority. In the course of the ascent, gold can be executed by a retest of the levels of the week-long golden cross passed the day before. The main upward direction and resistance are now located in the area of 1300.86 (monthly Tenkan + weekly Kijun + day Tenkan) and 1316.15 - 1323.22 (weekly Tenkan + weekly Fibo Kijun + daily Kijun).
Indicator parameters:
All time intervals 9 - 26 - 52
The color of indicator lines:
Tenkan (short-term trend) - red,
Kijun (medium-term trend) - green,
Fibo Kijun is a green dotted line,
Chinkou is gray,
Clouds: Senkou Span B (SSB, long-term trend) - blue,
Senkou Span A (SSA) - pink.
The color of additional lines:
Support and resistance MN - blue, W1 - green, D1 - red, H4 - pink, H1 - gray,
Horizontal levels (not Ichimoku) - brown,
Trend lines - purple.
InstaForex analytical reviews will make you fully aware of market trends! Being an InstaForex client, you are provided with a large number of free services for efficient trading.

