 Stay
Stay 
Trading Conditions
Products
Tools


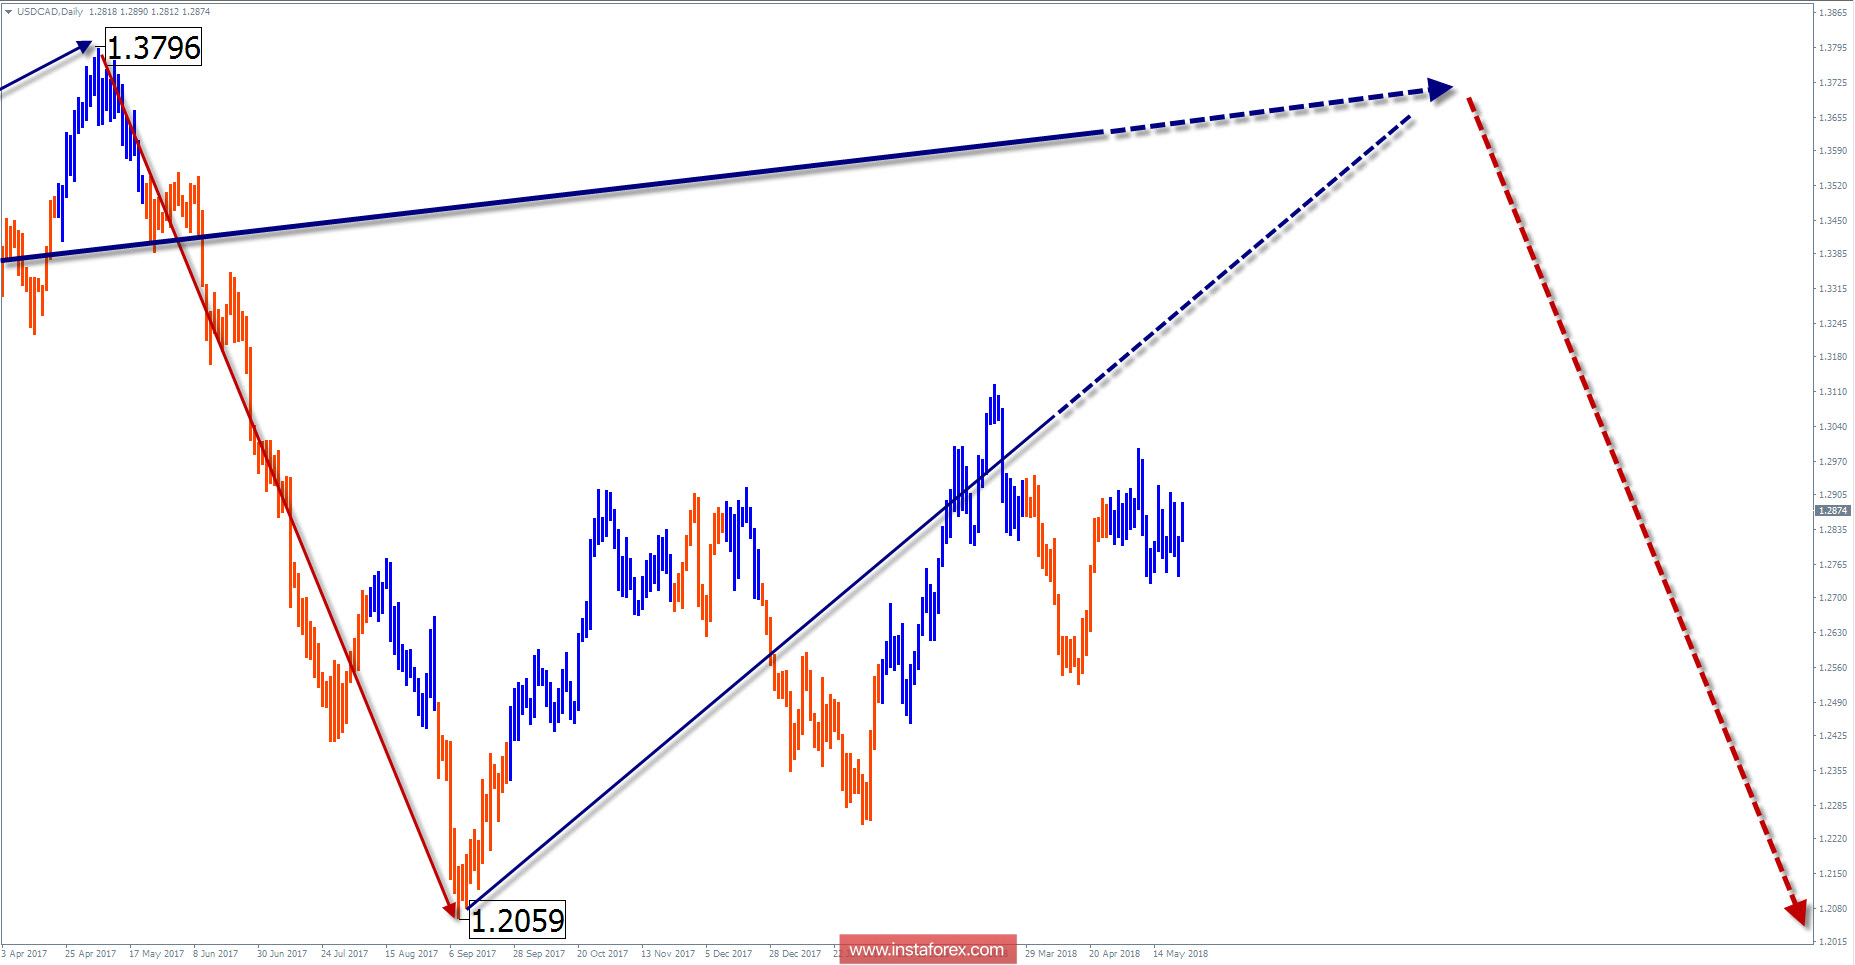
The wave pattern of the D1 graph:
Since the decline of the pair on January 2016 on the chart, a downward wave of a larger all-inclusive scale of the chart is forming. The middle part of the wave (B) has an irregular view, with an elongation toward the main direction of the trend. Started in September last year, the final part of the correction is approaching the target zone.
The wave pattern of the H1 graph:
The last wave is upward, counting from April 17. By now, the correctional part of the structure is being formed within its framework.
The wave pattern of the M15 chart:
The wave of May 8 is in the process of formation at the time of analysis. The nature of the movement is flat and price fluctuations can occur mainly on the side price boundary.

Recommended trading strategy:
For all styles of trading, the most promising signals for purchase can be found in the area of the support zone. Proponents of the inter-trading style can attempt for short sales, with an upward potential to the turnaround zone.
Resistance zones:
- 1.2940 / 1.2990
Support zones:
- 1.2660 / 1.2610
Explanations to the figures:
A simplified wave analysis uses a simple waveform, in the form of a 3-part zigzag (ABC). The last incomplete wave for every timeframe is analyzed. Zones show the calculated areas with the greatest probability of a turn.
Arrows indicate the counting of wave according to the technique used by the author. The solid background shows the generated structure and the dotted exhibits the expected wave motion.
Attention: The wave algorithm does not take into account the duration of the tool movements in time. To conduct a trade transaction, you need to confirm the signals used by your trading systems.
InstaForex analytical reviews will make you fully aware of market trends! Being an InstaForex client, you are provided with a large number of free services for efficient trading.

