 Stay
Stay 
Trading Conditions
Products
Tools


Wave picture of the chart D1:
The dominant trend on the daily scale of the cross plot is directed to the "north". The wave level of motion is very high, it allows ranking on the W1 scale. A correction was formed from the reversal zone in the recent months.
The wave pattern of the graph H1:
The last unfinished wave plot from April 13 is included in the structure of the larger downward wave zigzag on the N4 timeframe. Calculation of the preliminary target zone gives a reference point in the area of the 143rd price figure.
The wave pattern of the M15 chart:
Since May 18, a bearish wave is developing. Within its framework, a counter-corrective movement has been formed since yesterday, after which the downward trend will continue.
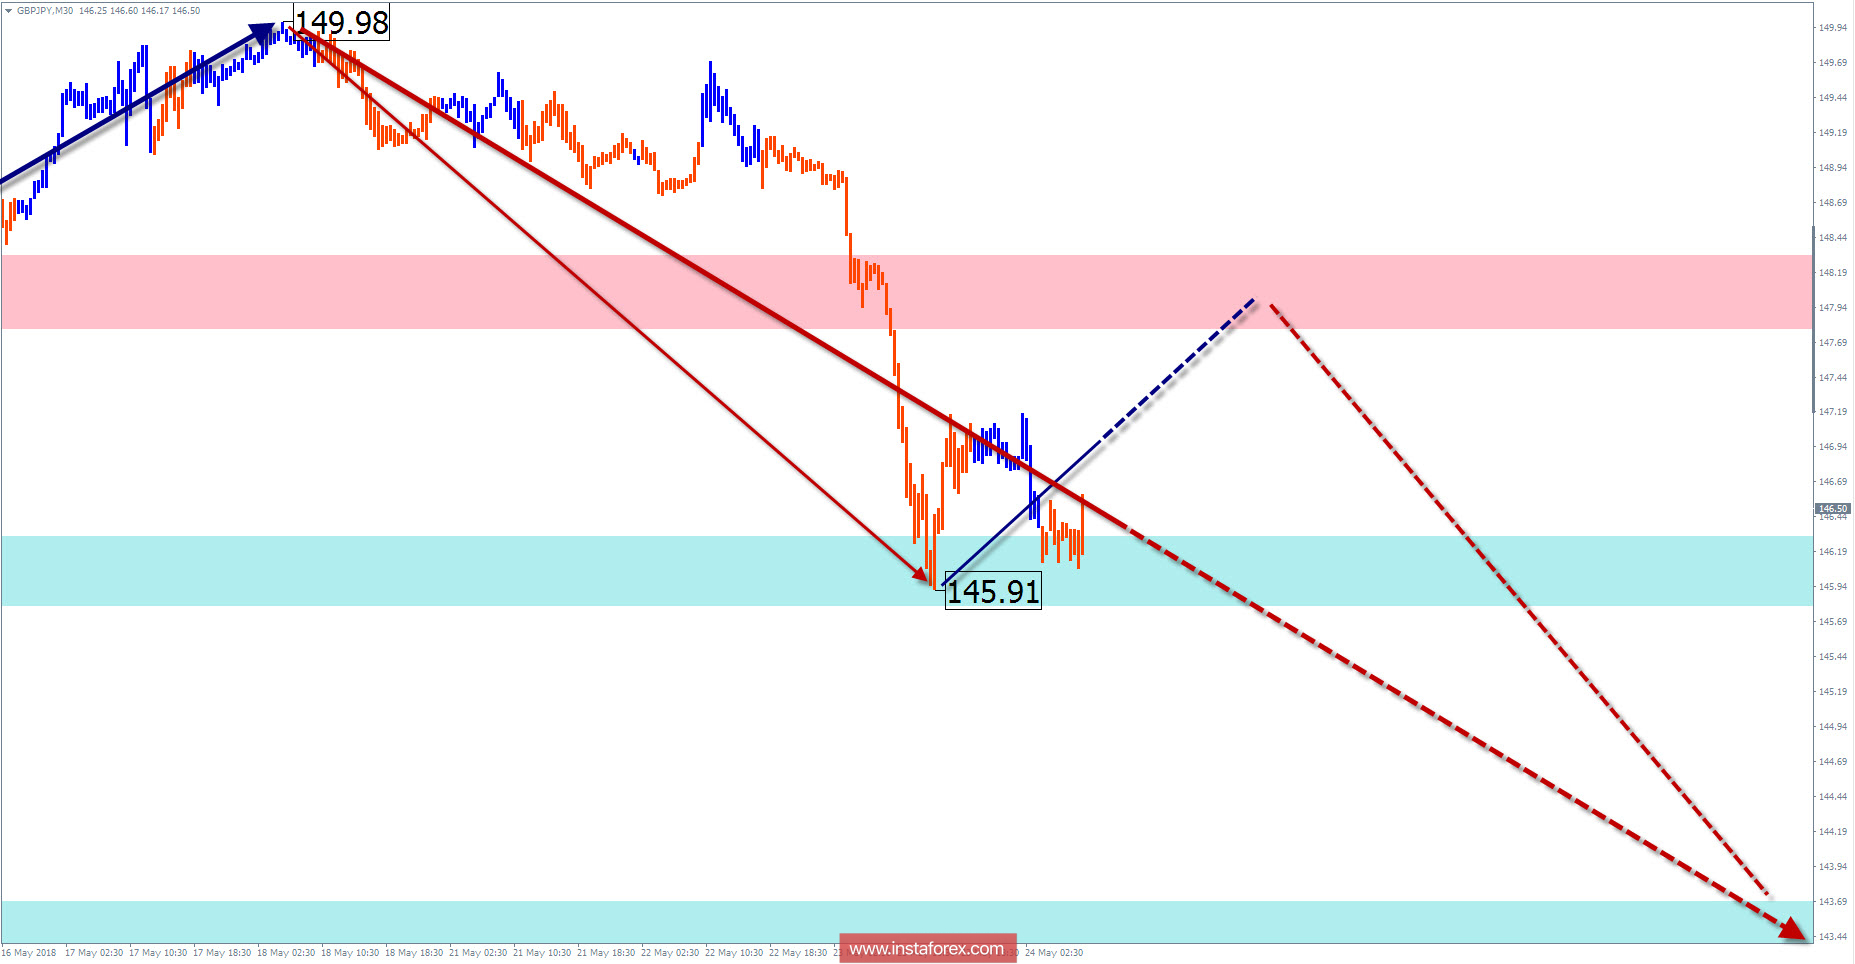
Recommended trading strategy:
It is better to refrain from trading transactions in Medium-term and wait for the completion of the current decline. Supporters of the inter-trading style can tear off sales after the completion of an upward rollback.
Resistance zones:
- 147.80 / 148.30
Support zones:
- 146.30 / 145.80
- 143.70 / 143.20
Explanations to the figures:
A simplified wave analysis uses a simple waveform, in the form of a 3-part zigzag (ABC). The last incomplete wave for every timeframe is analyzed. Zones show the calculated areas with the greatest probability of a turn.
Arrows indicate the counting of wave according to the technique used by the author. The solid background shows the generated structure and the dotted exhibits the expected wave motion.
Attention: The wave algorithm does not take into account the duration of the tool movements in time. To conduct a trade transaction, you need to confirm the signals used by your trading systems.
InstaForex analytical reviews will make you fully aware of market trends! Being an InstaForex client, you are provided with a large number of free services for efficient trading.


