 Stay
Stay 
Trading Conditions
Products
Tools


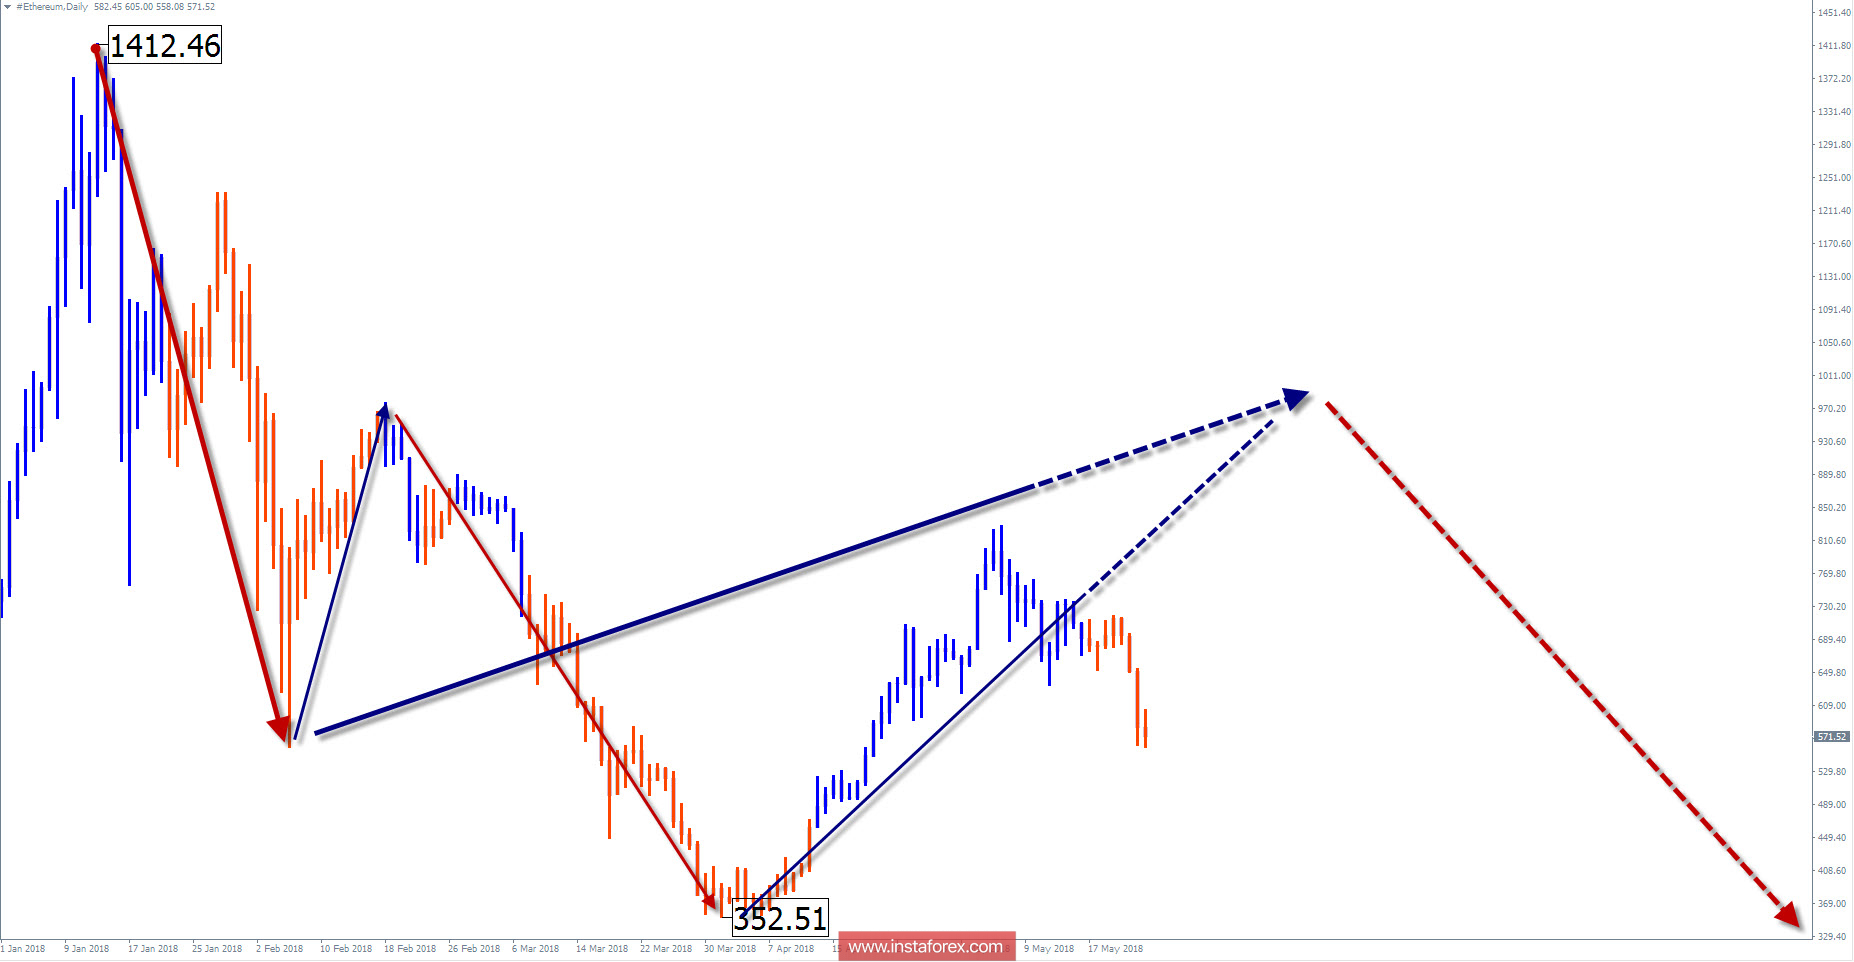
Wave picture of the D1 chart:
The latest and the actual wave construction for today based on this scale chart of the Ether is counting from January 14. The wave is descending which has an unfinished structure. In the previous months, the middle part of the wave (B) takes its shape in the complex sideways flat.
The wave pattern of the H1 graph:
The direction of the inter-week trend is set by the downward wave of May 5. In a larger model of TF H4, it will take the place of correction.
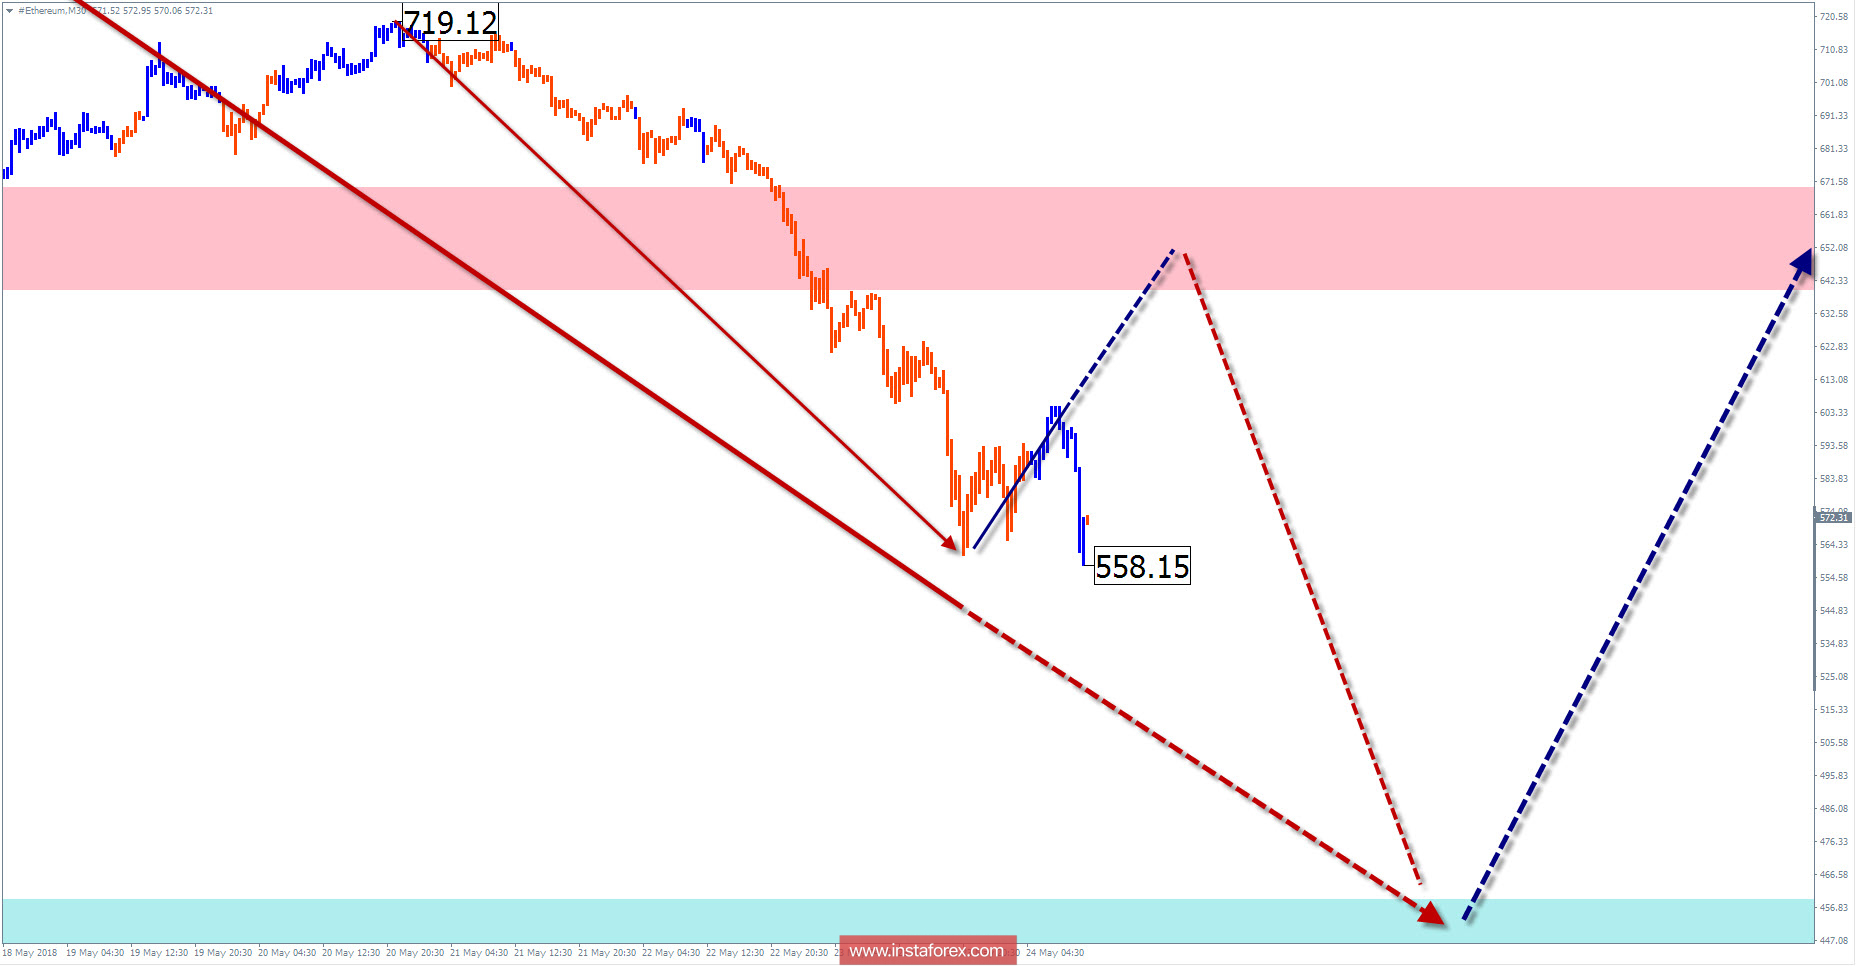
The wave pattern of the M15 chart:
The last trend section started on May 13. In the coming days, there is a high probability of a short-term price hike. The potential area for completing the decline is in the support area.
Recommended trading strategy:
Short-term sales can be recommended to supporters of intra- and inter-day trading. The rest should wait for the completion of the current decline and look for signals purchases of cryptocurrency.
Resistance zones:
- 640/670
Support zones:
- 460/430
Explanations to the figures: Simplified wave analysis uses a simple waveform, in the form of a 3-part zigzag (ABC). Every TF shows that the last incomplete wave is analyzed. Zones show the calculated areas with the greatest probability of a reversal.
Arrows indicate the wave counting according to the technique used by the trader. The solid background shows the generated structure, dotted - the expected wave motion.
Attention: The wave algorithm does not take into account the duration of the tool movements in time. To conduct a trade transaction, you need confirmation signals from your trading systems!
* The presented market analysis is informative and does not constitute a guide to the transaction.
InstaForex analytical reviews will make you fully aware of market trends! Being an InstaForex client, you are provided with a large number of free services for efficient trading.


