 Stay
Stay 
Trading Conditions
Products
Tools


Wave picture of the D1 chart:
Earlier in December 2016, the ascending section of the euro major timeframe has not been completed. In the wave structure since January, the first part of the downward correction is forming,nearing completion.
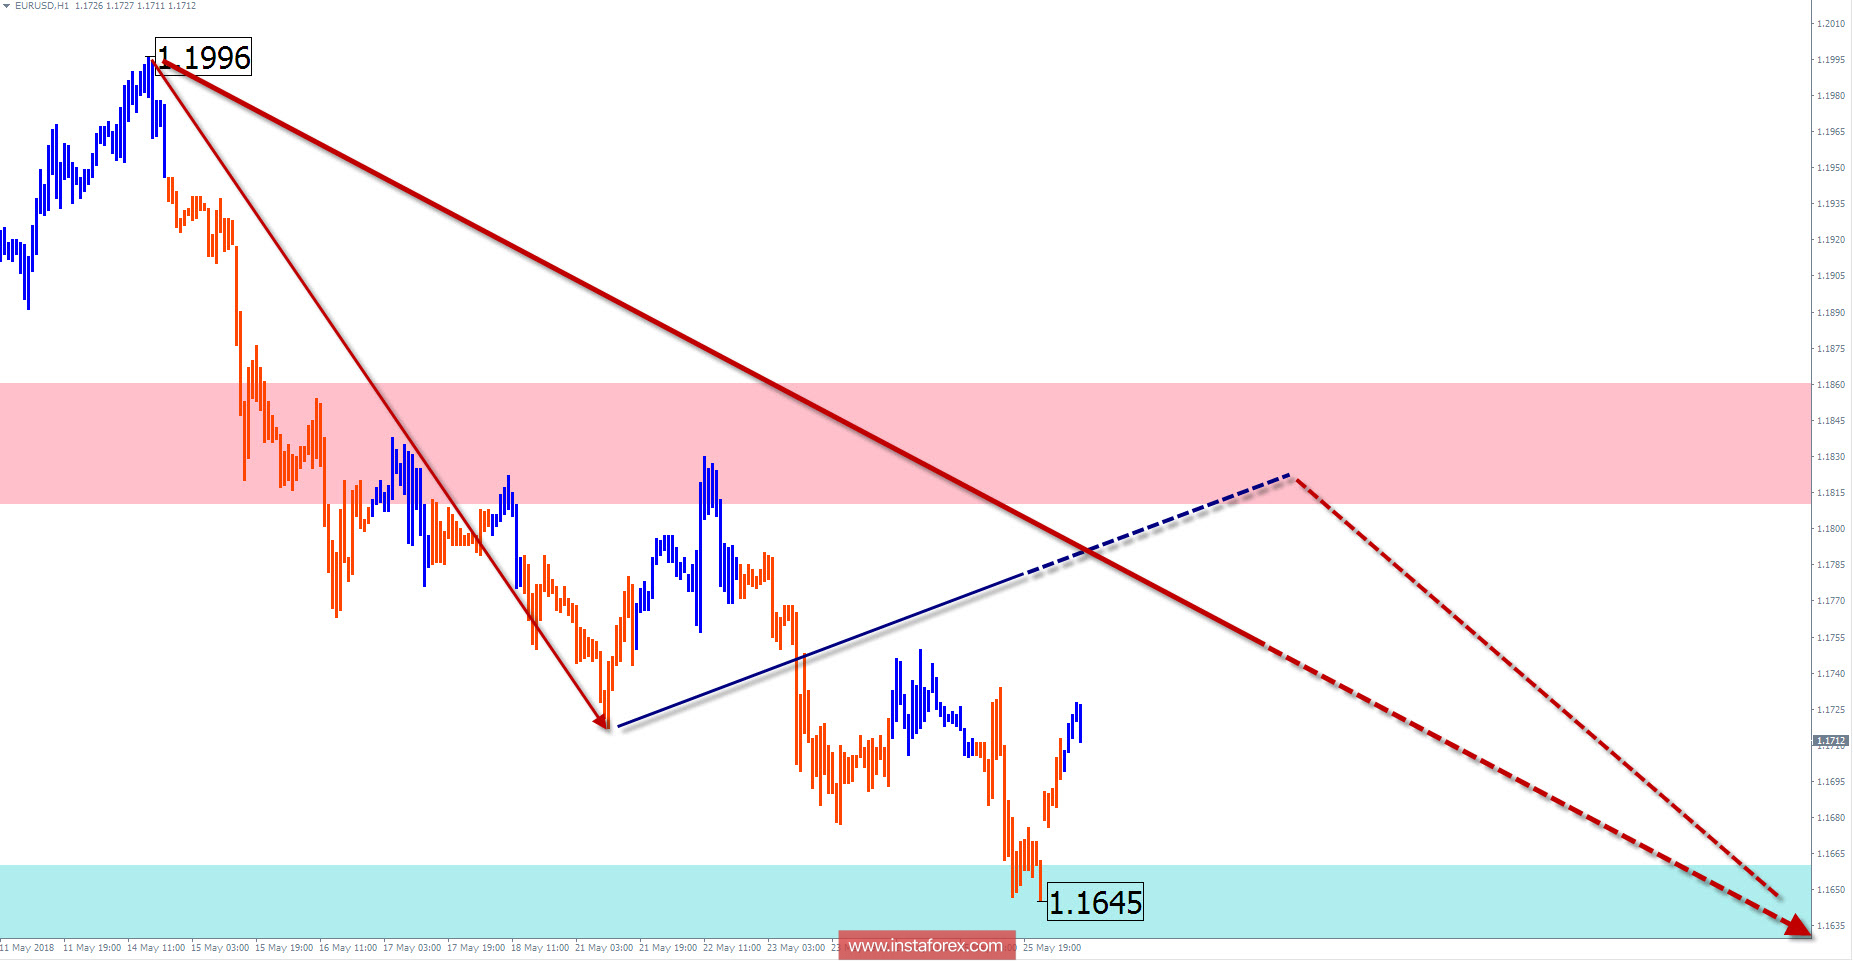
The wave pattern of the H1 graph:
The current wave of April 17 sets the price of the pair in a bearish rate. The wave completes a larger wave structure. Quotations have reached the upper boundary of the incoming zone of potential reversal.
The wave pattern of the M15 chart:
Since May 15, the last, incomplete wave zigzag started. From the support zone in the last days up, an incorrect correction is formed.
Recommended trading strategy:
Traders trading in large sections of the timeframe by the end of the week can start tracking signals for purchase. For short-term traders, there are possible short-term sales from the resistance zone.
Resistance zones:
- 1.1810 / 1.1860
Support zones:
- 1.1660 / 1.1610
Explanations to the figures: Simplified wave analysis uses a simple waveform, in the form of a 3-part zigzag (ABC). Every TF shows that the last incomplete wave is analyzed. Zones show the calculated areas with the greatest probability of a reversal.
Arrows indicate the wave counting according to the technique used by the trader. The solid background shows the generated structure, dotted - the expected wave motion.
Attention: The wave algorithm does not take into account the duration of the tool movements in time. To conduct a trade transaction, you need confirmation signals from your trading systems!
* The presented market analysis is informative and does not constitute a guide to the transaction.
InstaForex analytical reviews will make you fully aware of market trends! Being an InstaForex client, you are provided with a large number of free services for efficient trading.


