 Stay
Stay 
Trading Conditions
Products
Tools


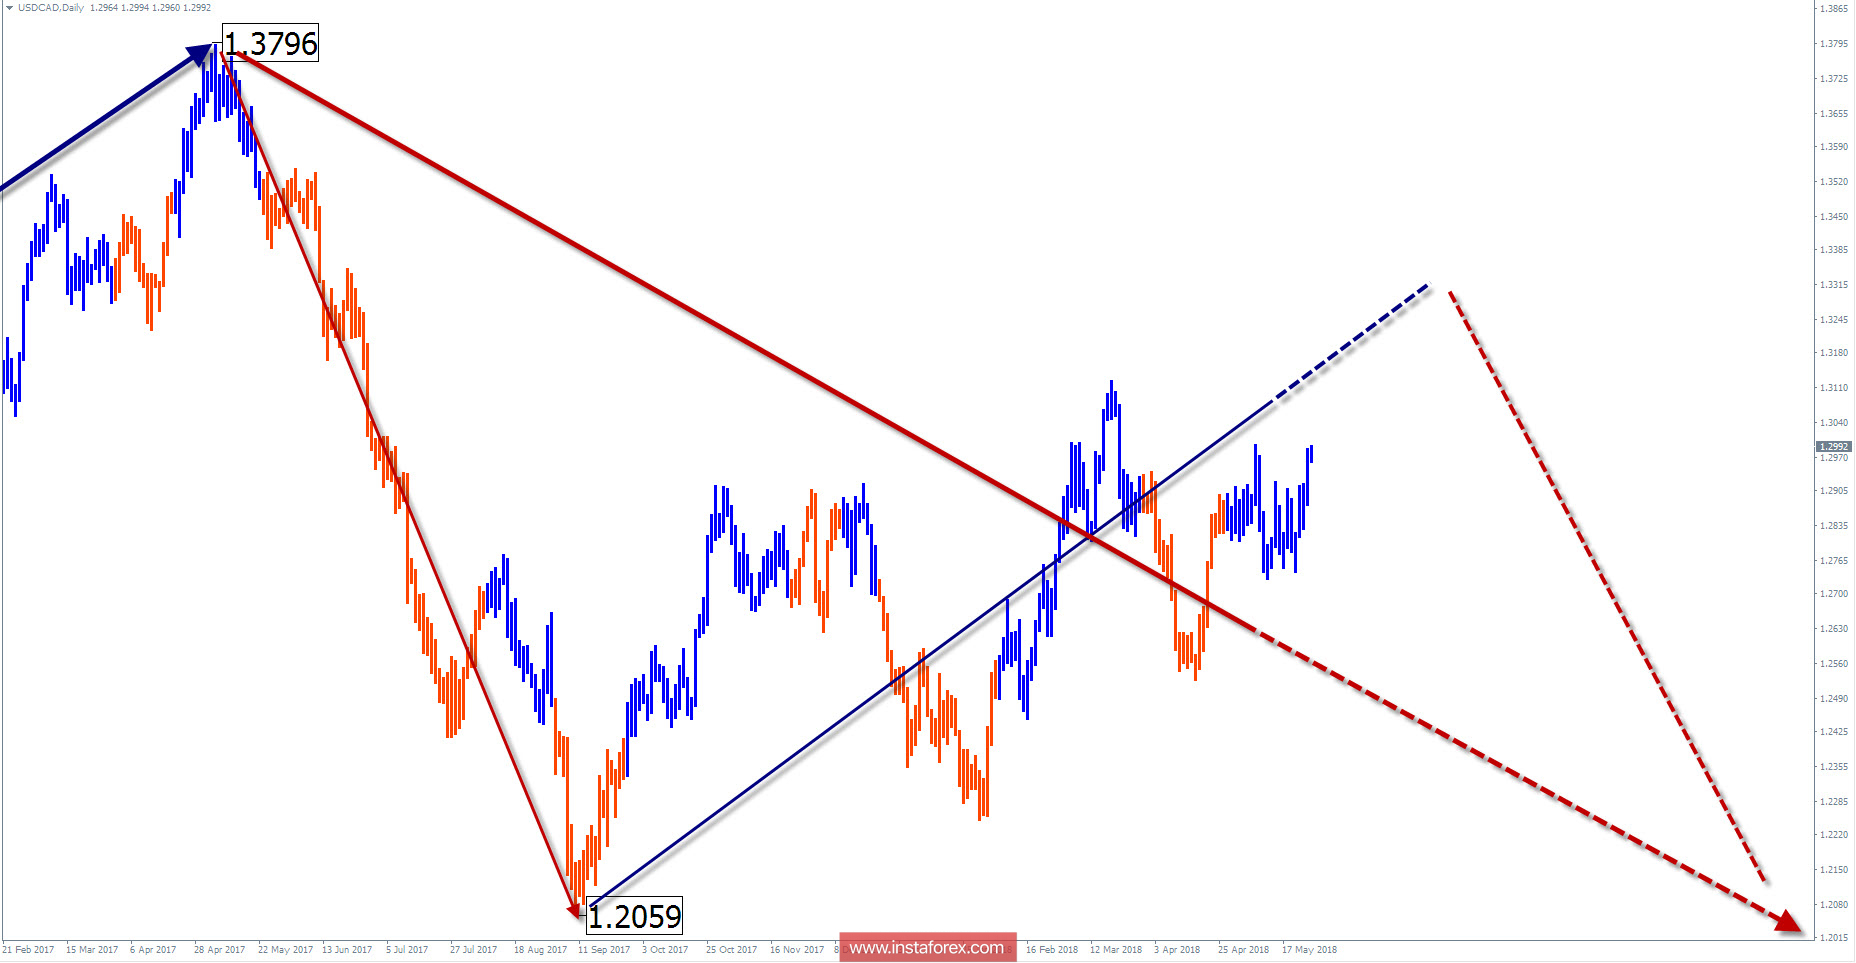
Wave picture of the chart D1:
The major dollar chart of the Canadian dollar since September of last year forms an upward wave. The nature of the movement is flat. In a larger wave formation, the wave corrects the main trend.
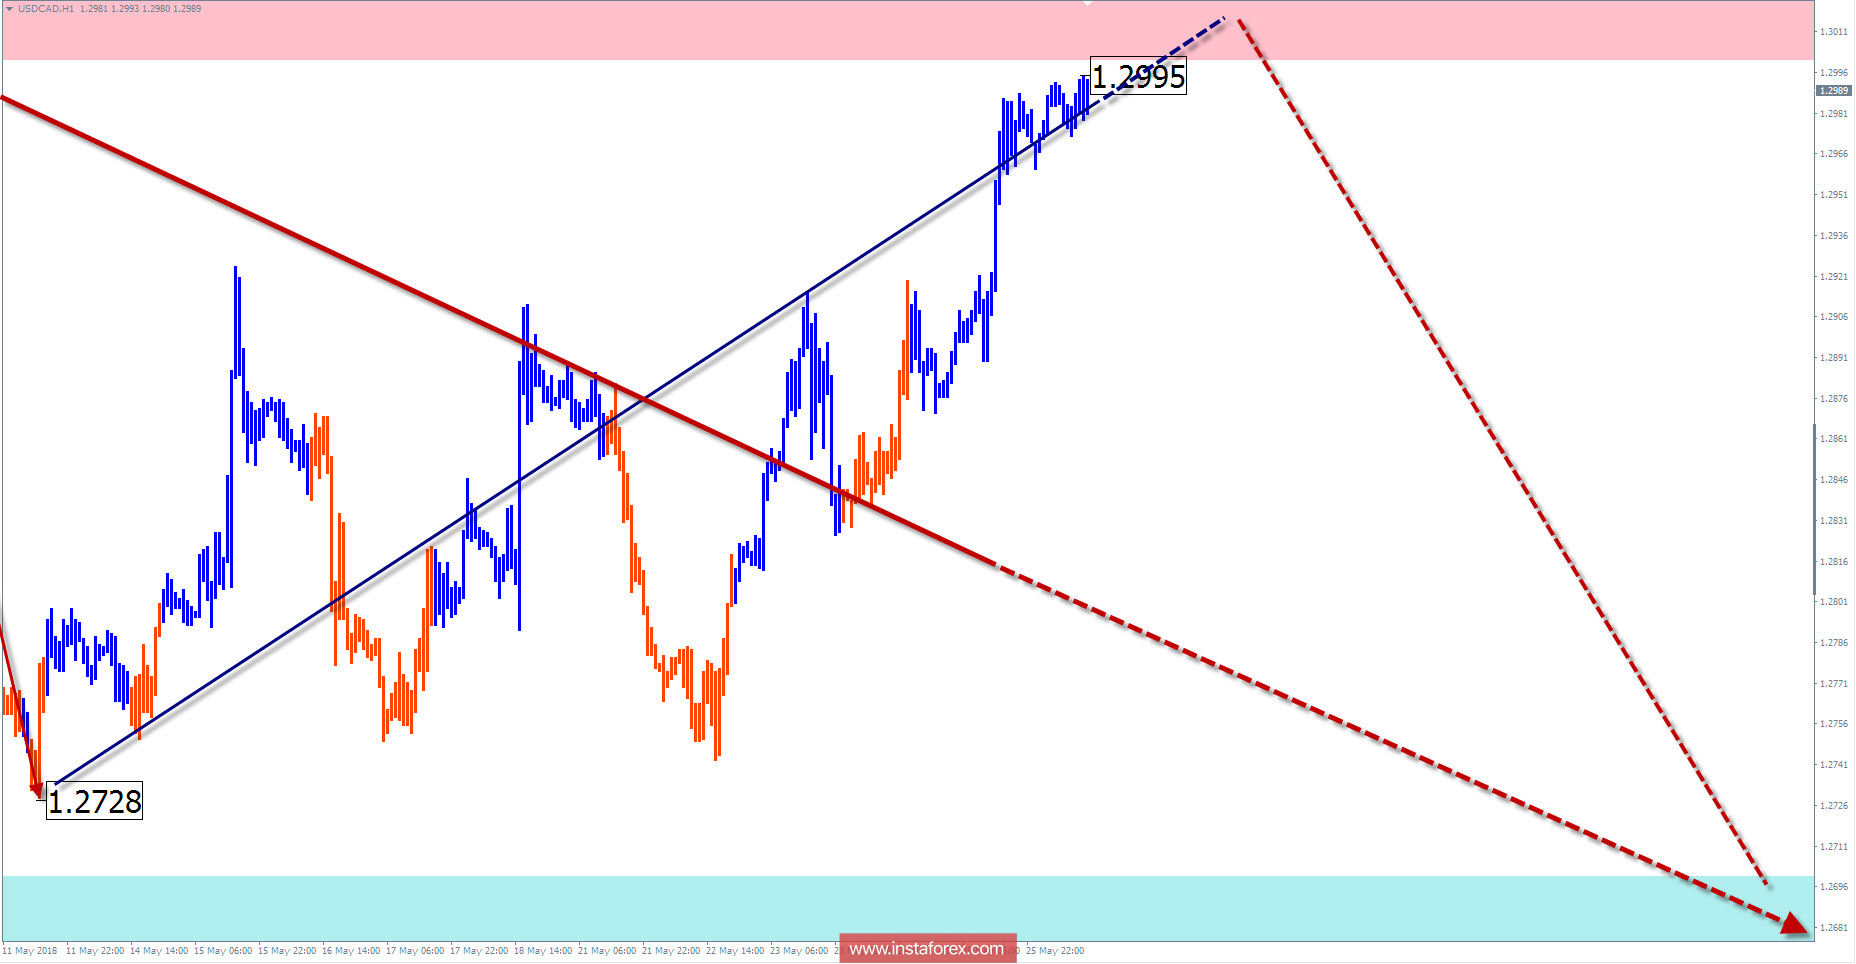
The wave pattern of the graph H1:
The last wave is up, from April 14. In the structure of motion, the middle part (B) is formed. The quotations of the pair are approaching the intermediate resistance zone.
The wave pattern of the M15 chart:
Over the past few weeks, a correction bearish wave has been forming in the lateral flute. In the near future, we can wait for the completion of its final part (C)
Recommended trading strategy:
Trading in the middle-class style makes sense to look for signals for sale. Traders that use medium-term need to wait for the completion of the entire correction.
Resistance zones:
- 1.3000 / 1.3050
Support zones:
- 1.2700 / 1.2650
Explanations to the figures: Simplified wave analysis uses a simple waveform, in the form of a 3-part zigzag (ABC). At each TF the last incomplete wave is analyzed. Zones show the calculated areas with the greatest probability of a turn.
Arrows indicate the wave counting according to the technique used by the author. The solid background shows the generated structure, dotted - the expected wave motion.
Attention: The wave algorithm does not take into account the duration of the tool movements in time. To conduct a trade transaction, you need confirmation signals from your trading systems!
InstaForex analytical reviews will make you fully aware of market trends! Being an InstaForex client, you are provided with a large number of free services for efficient trading.


