 Stay
Stay 
Trading Conditions
Products
Tools


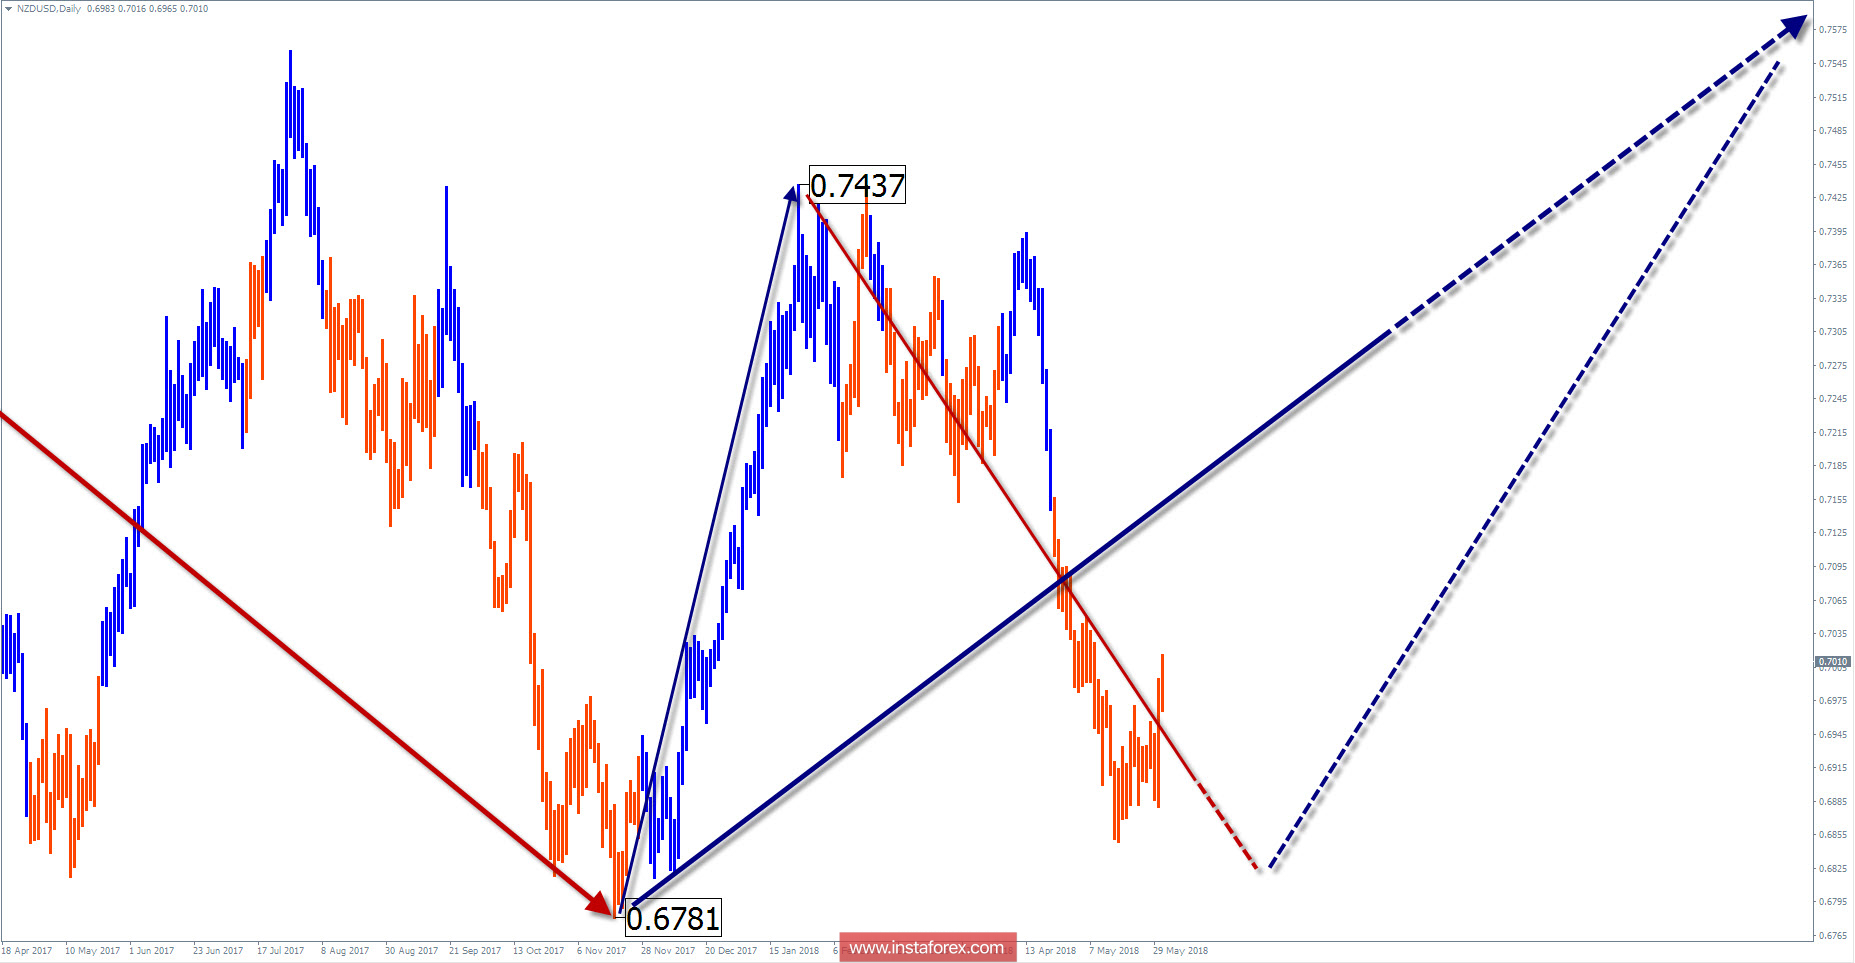
Wave picture of the chart D1:
The major pair "kiwi" has been in the side price corridor for the last 2 years. One can single out the last bullish wave zigzag of November 17 last year. The wave level of this movement exceeds the correction level of the previous drop section.
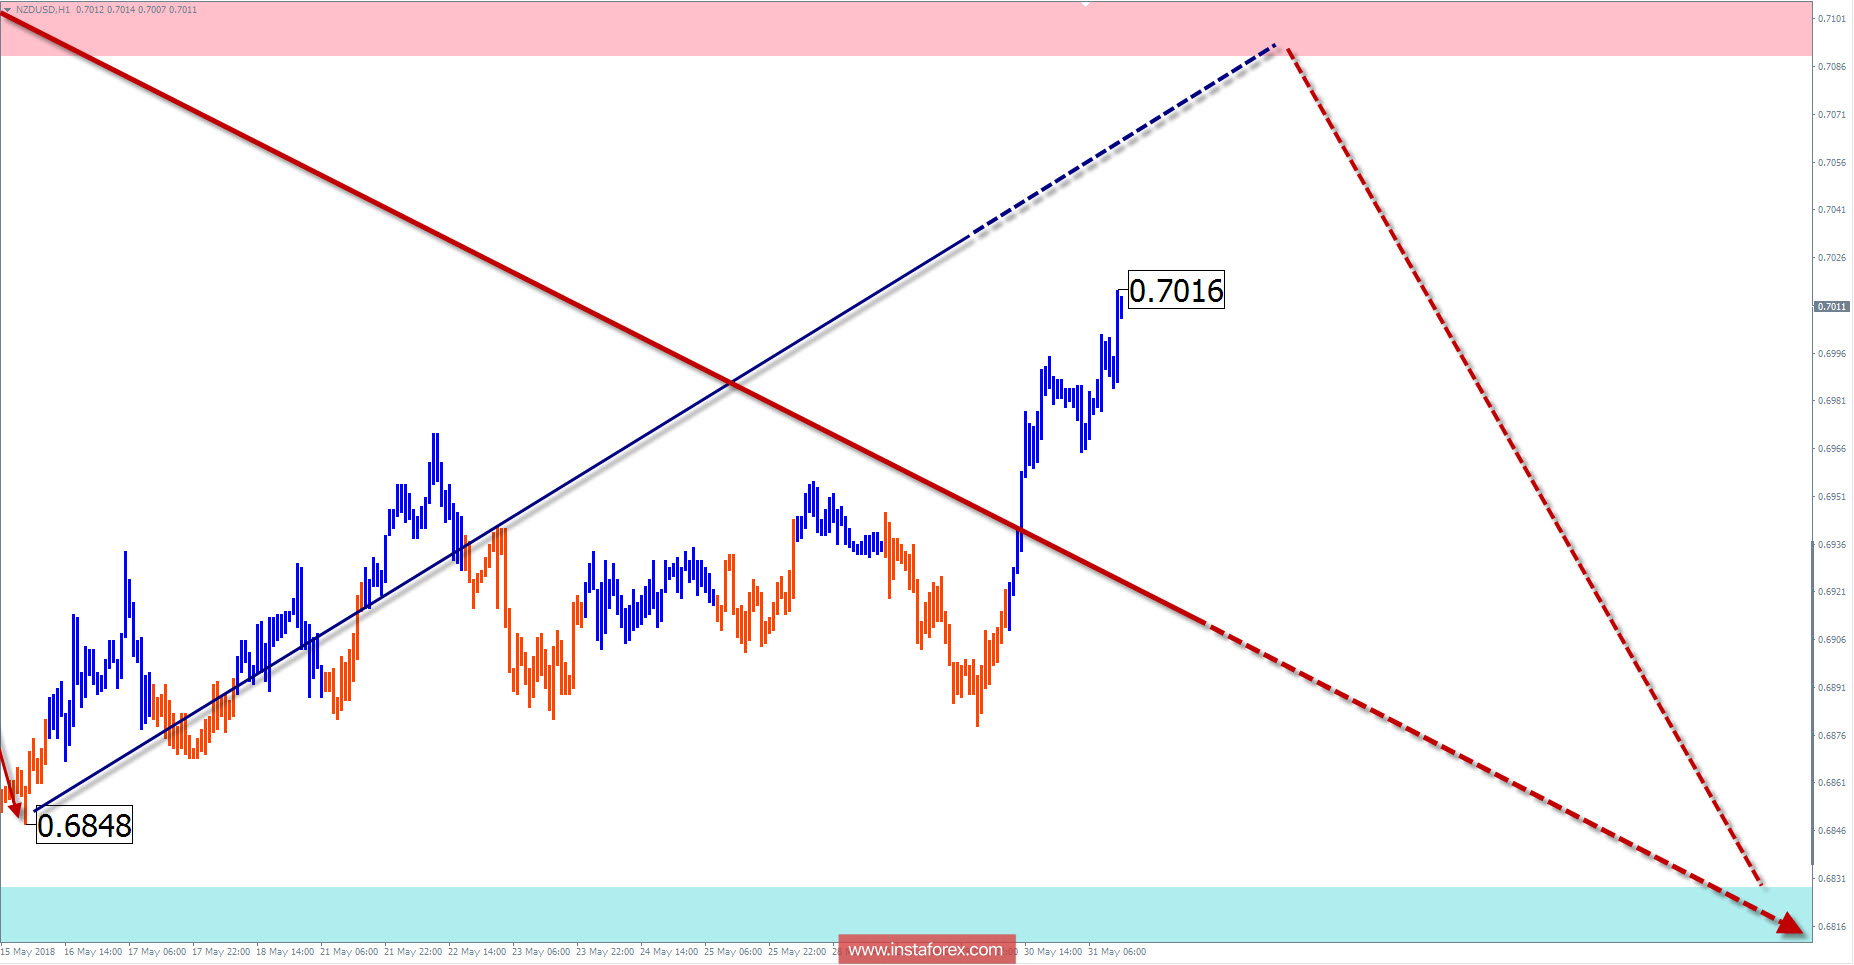
The wave pattern of the graph H1:
The descending wave of April 13 is the final part (C) of a larger bearish model. Its structure for the last two weeks, the price forms the final part of the corrective rollback upwards.
The wave pattern of the M15 chart:
The bullish wave of May 16 is not complete. The preliminary target area is within the limits of the calculated resistance zone.
Recommended trading strategy:
During the short-term trading, it makes sense to look for sales signals in the area of the target zone. The traders that are practicing larger sections of the schedule need to wait for the completion of the entire downward wave for trading.
Resistance zones:
- 0.7090 / 0.7140
Support zones:
- 0.6830 / 0.6780
Explanations to the figures: Simplified wave analysis uses a simple waveform, in the form of a 3-part zigzag (ABC). At each TF the last incomplete wave is analyzed. Zones show the calculated areas with the greatest probability of a turn.
Arrows indicate the wave counting according to the technique used by the author. The solid background shows the generated structure, dotted - the expected wave motion.
Attention: The wave algorithm does not take into account the duration of the tool movements in time. To conduct a trade transaction, you need confirmation signals from your trading systems!
InstaForex analytical reviews will make you fully aware of market trends! Being an InstaForex client, you are provided with a large number of free services for efficient trading.

