 Stay
Stay 
Trading Conditions
Products
Tools


Wave picture of the chart D1:
Quotations of gold since December 2016 keep a steady vector on the "north" of the chart. The current wave formed the final part (C) in a larger-scale wave model and is not yet completed.
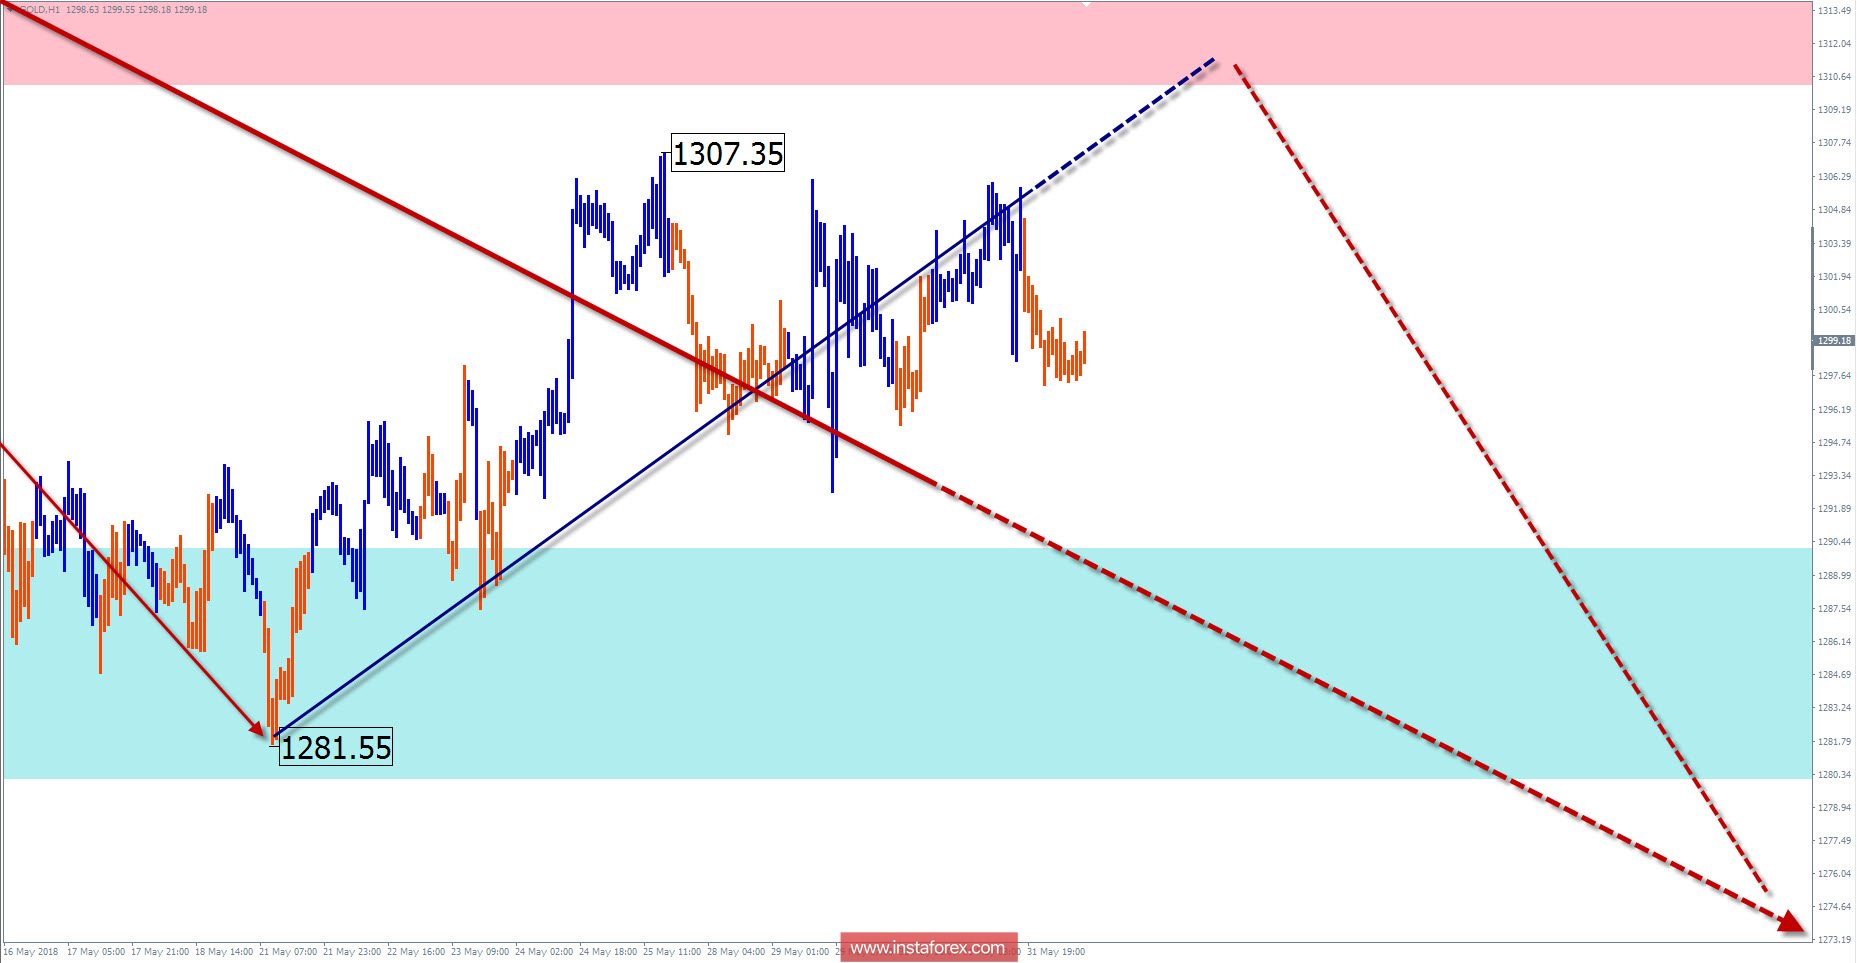
The wave pattern of the graph H1:
The price has formed a bearish zigzag since April 11. In turn, it is part of a more massive bearish wave model. The upper boundary of the preliminary target zone is located at around 1250 dollars / ounce.
The wave pattern of the M15 chart:
Since May 21, the ascending structure is developing. Completion of the entire recovery is most likely in the zone of design resistance.
Recommended trading strategy:
Gold sales can be used for trading on the small scale of the schedule. When trading on the N1 timeframe, higher traders must wait for the completion of the bearish correction and look for signals to buy.
Resistance zones:
- 1310.0 / 1320.0
Support zones:
- 1290.0 / 1280.0
Explanations to the figures:
A simplified wave analysis uses a simple waveform, in the form of a 3-part zigzag (ABC). The last incomplete wave for every timeframe is analyzed. Zones show the calculated areas with the greatest probability of a turn.
Arrows indicate the counting of wave according to the technique used by the author. The solid background shows the generated structure and the dotted exhibits the expected wave motion.
Attention: The wave algorithm does not take into account the duration of the tool movements in time. To conduct a trade transaction, you need to confirm the signals used by your trading systems.
InstaForex analytical reviews will make you fully aware of market trends! Being an InstaForex client, you are provided with a large number of free services for efficient trading.


