 Stay
Stay 
Trading Conditions
Products
Tools


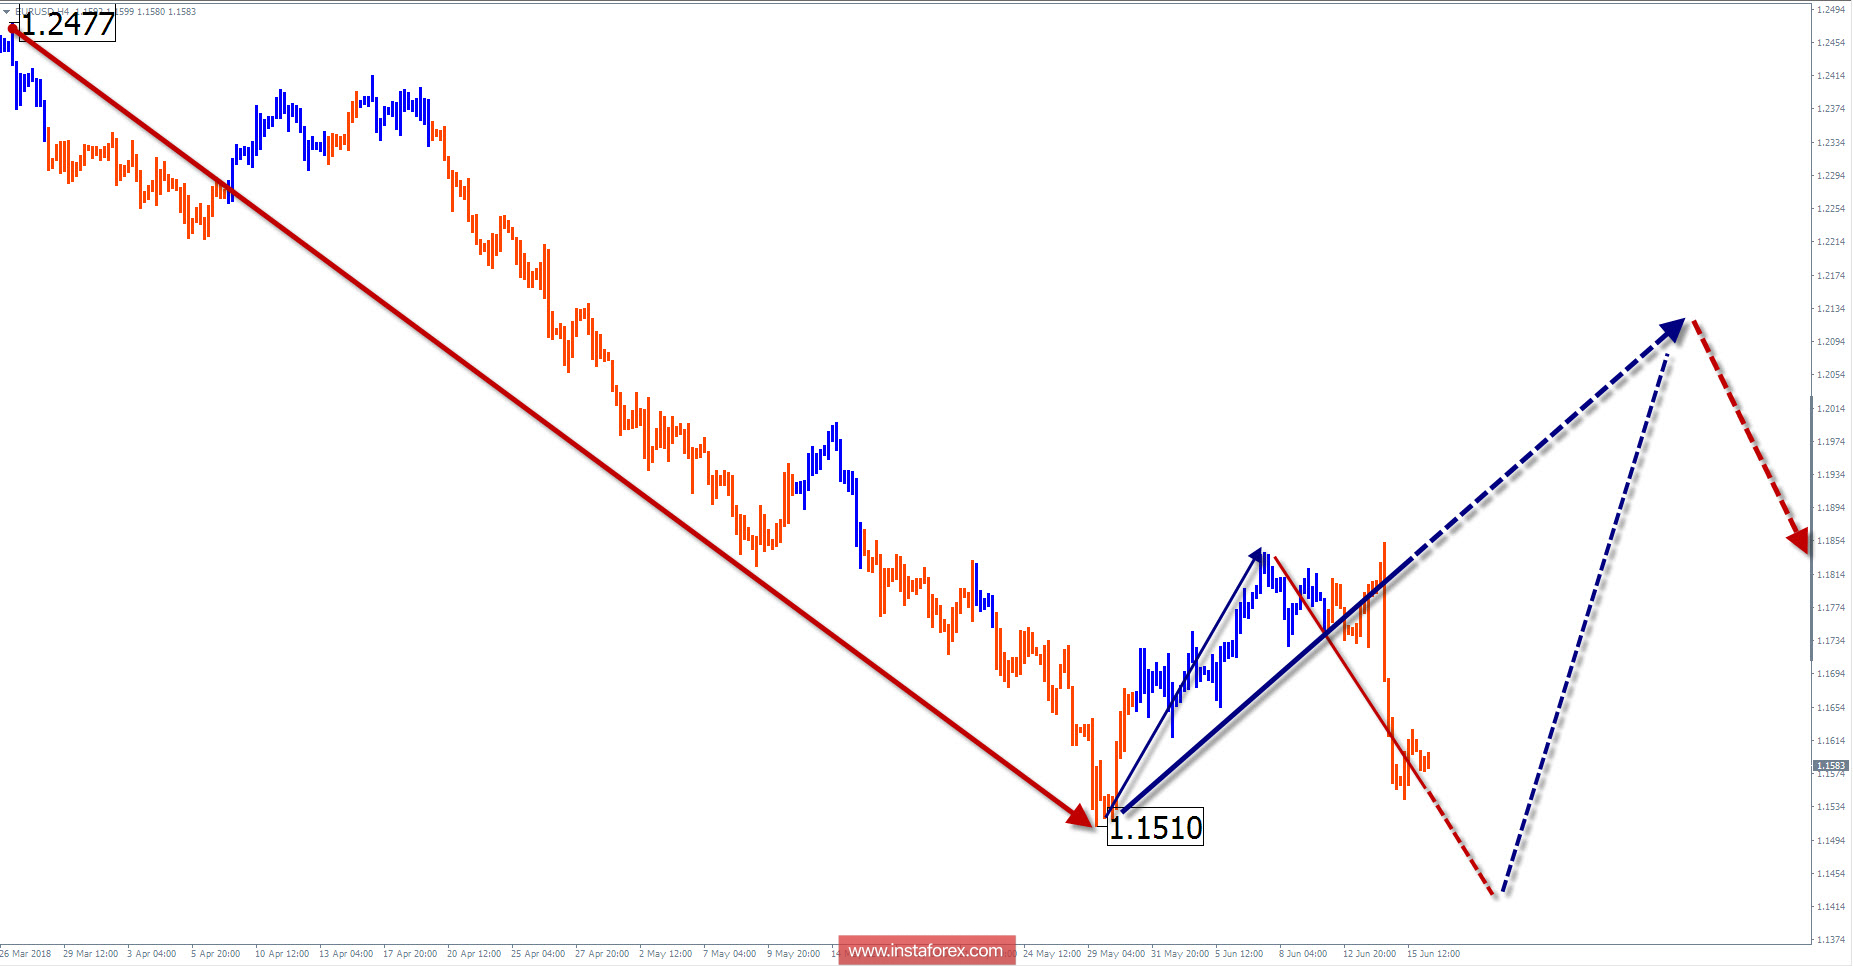
The wave pattern of the H4 graph:
The unfinished wave of the euro major pair from January 25 is heading "south" on chart and reached the intermediate support zone.
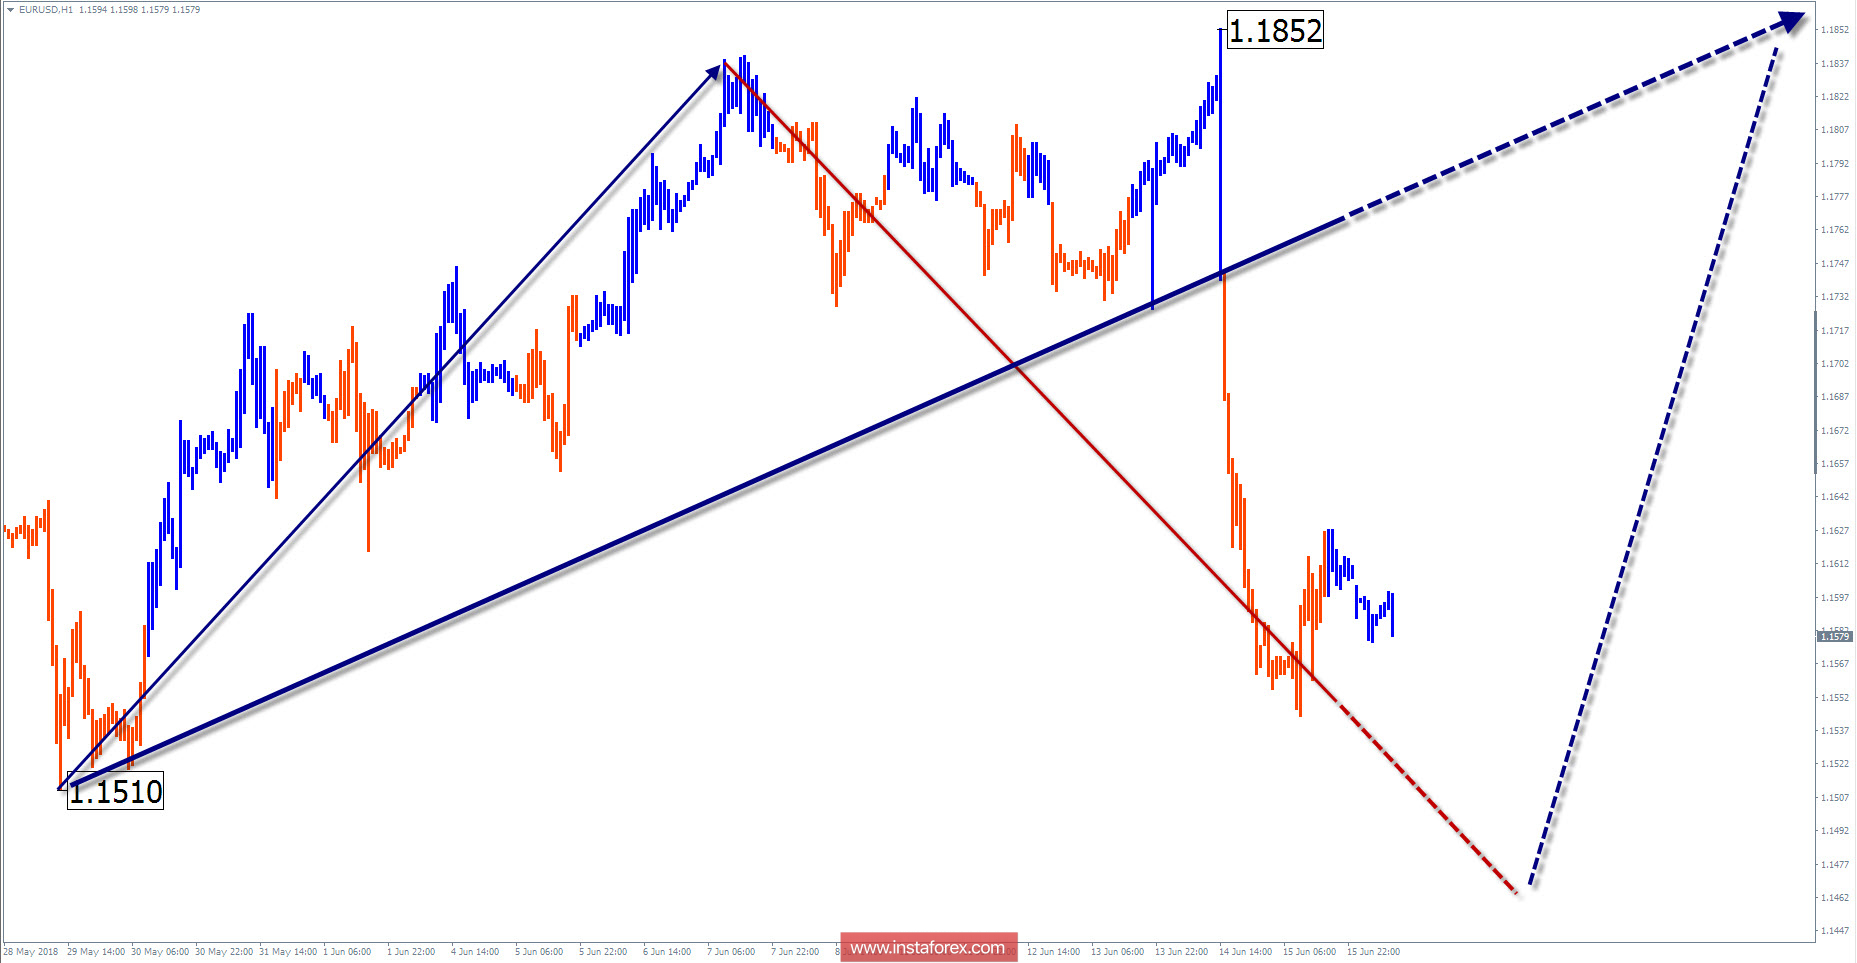
The wave pattern of the H1 graph:
The last downward wave since the end of March has been formed. Last month, the formation of a counter correction began.
The wave pattern of the M15 chart:
The ascending segment from May 29 became the first part (A) of the bull wave. Last week, the middle phase of the movement (B) began. With a high probability, the wave will take the wrong kind of structure.

Recommended trading strategy:
At this stage of the price movement, sales are not recommended. In the support area, monitor the signals for buying the instrument.
Resistance zones:
- 1.1930 / 1.1980
Support zones:
- 1.1520 / 1.1470
Explanations to the figures:
A simplified wave analysis uses a simple waveform, in the form of a 3-part zigzag (ABC). The last incomplete wave for every time frame is analyzed. Zones show the calculated areas with the greatest probability of a turn.
Arrows indicate the counting of wave according to the technique used by the author. The solid background shows the generated structure and the dotted exhibits the expected wave motion.
Attention: The wave algorithm does not take into account the duration of the tool movements in time. To conduct a trade transaction, you need to confirm the signals used by your trading systems.
InstaForex analytical reviews will make you fully aware of market trends! Being an InstaForex client, you are provided with a large number of free services for efficient trading.


