 Stay
Stay 
Trading Conditions
Products
Tools


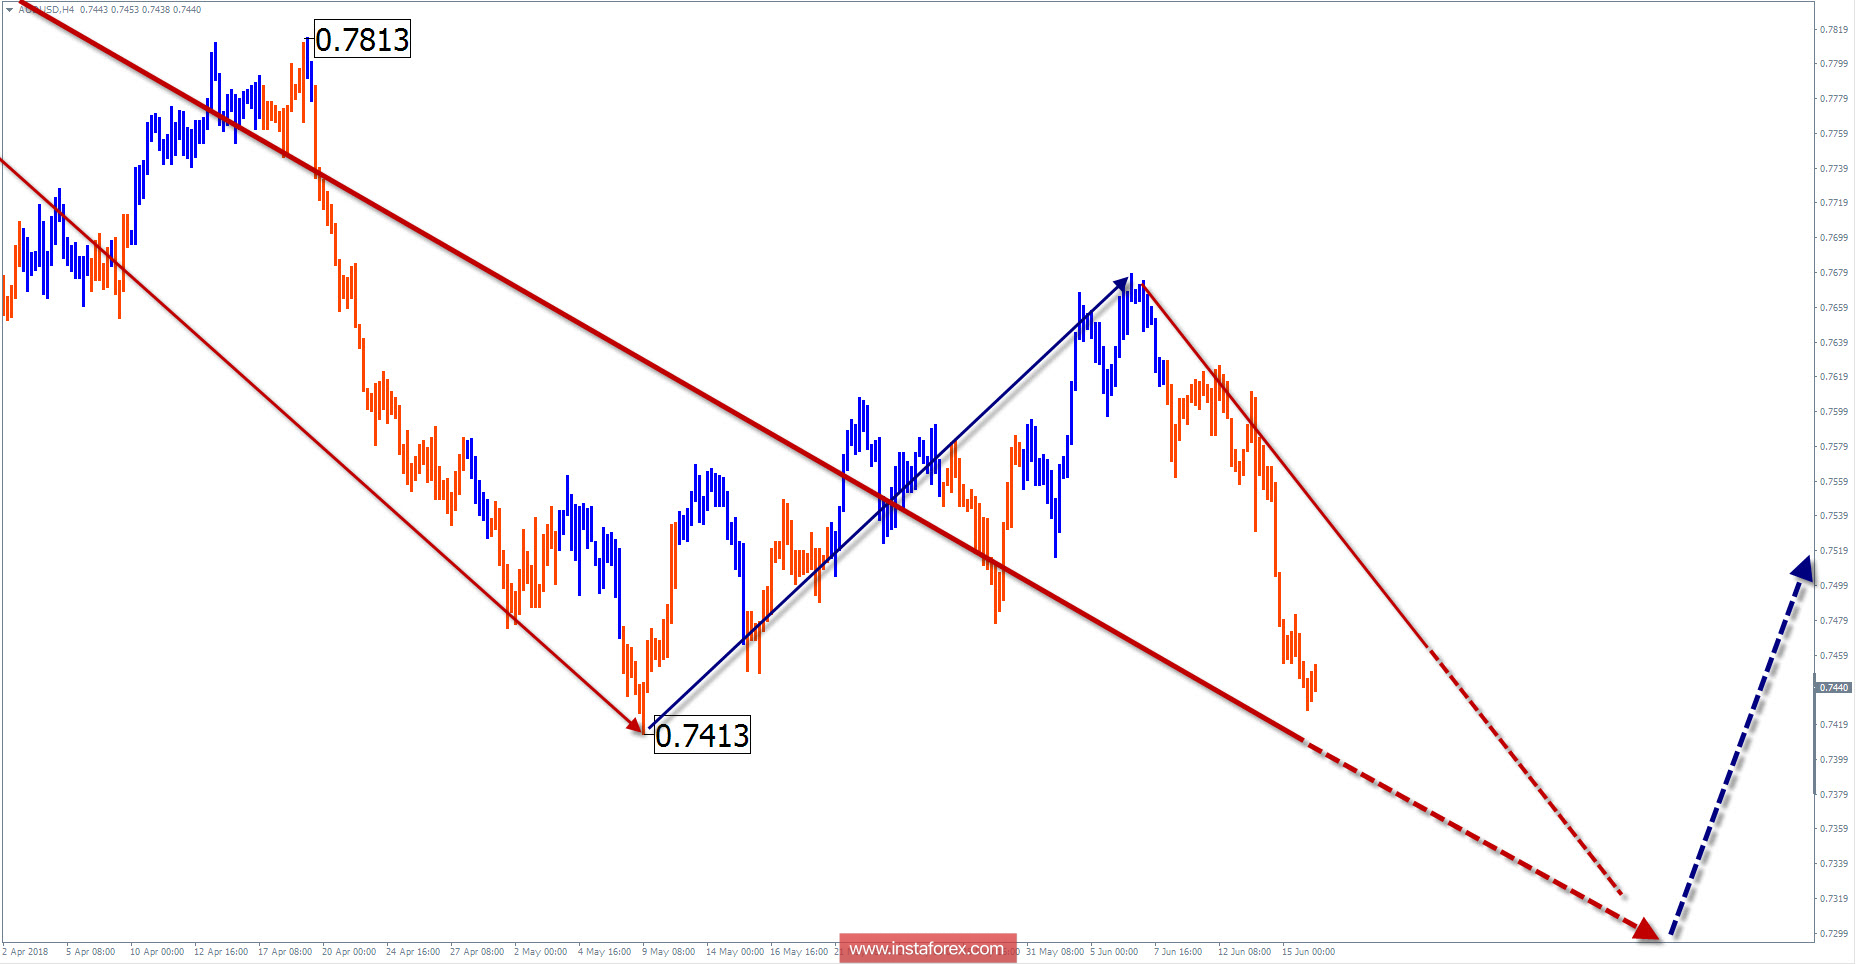
The wave pattern of the H4 graph:
The direction of short-term trends of the "Aussie" major pair sets the downward wave algorithm from January 26. In a larger model, the section completes the wave structure (A-B-C), which explains the overall impulsive nature of the motion.
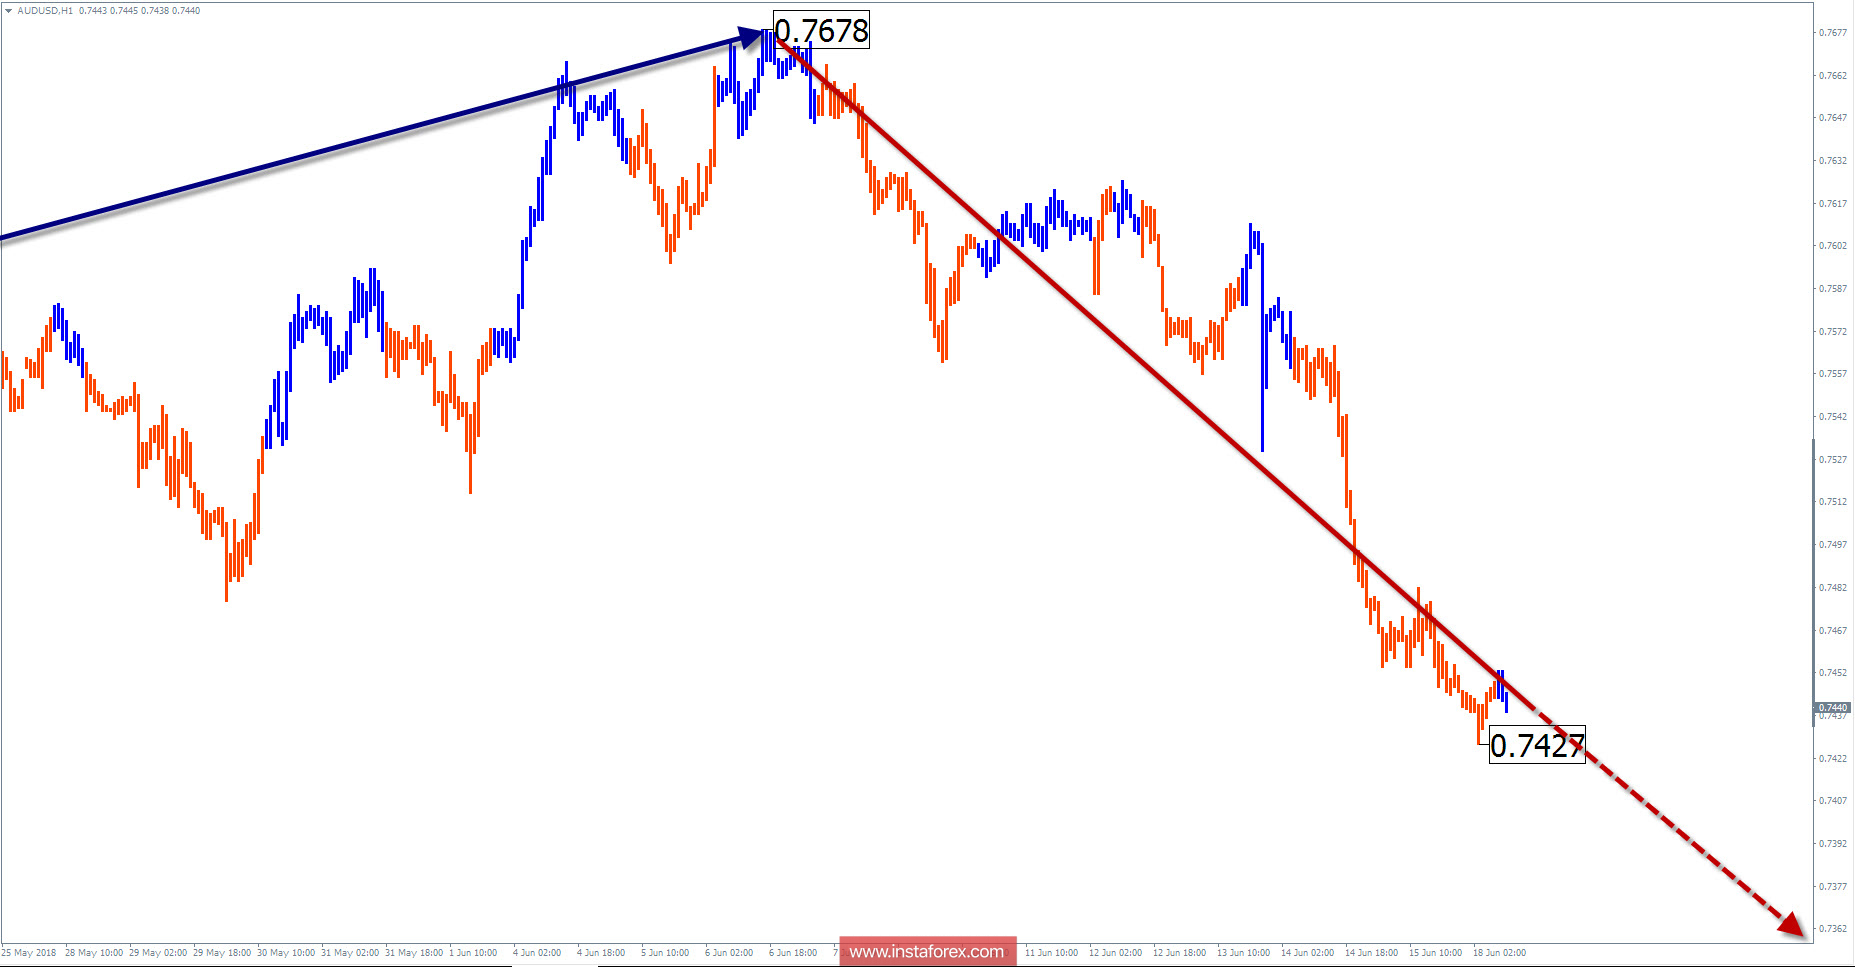
The wave pattern of the H1 graph:
The ascending segment of the graph dated May 9 completed the irregular upward correction of the pair. The bearish phase that began later has a great potential.
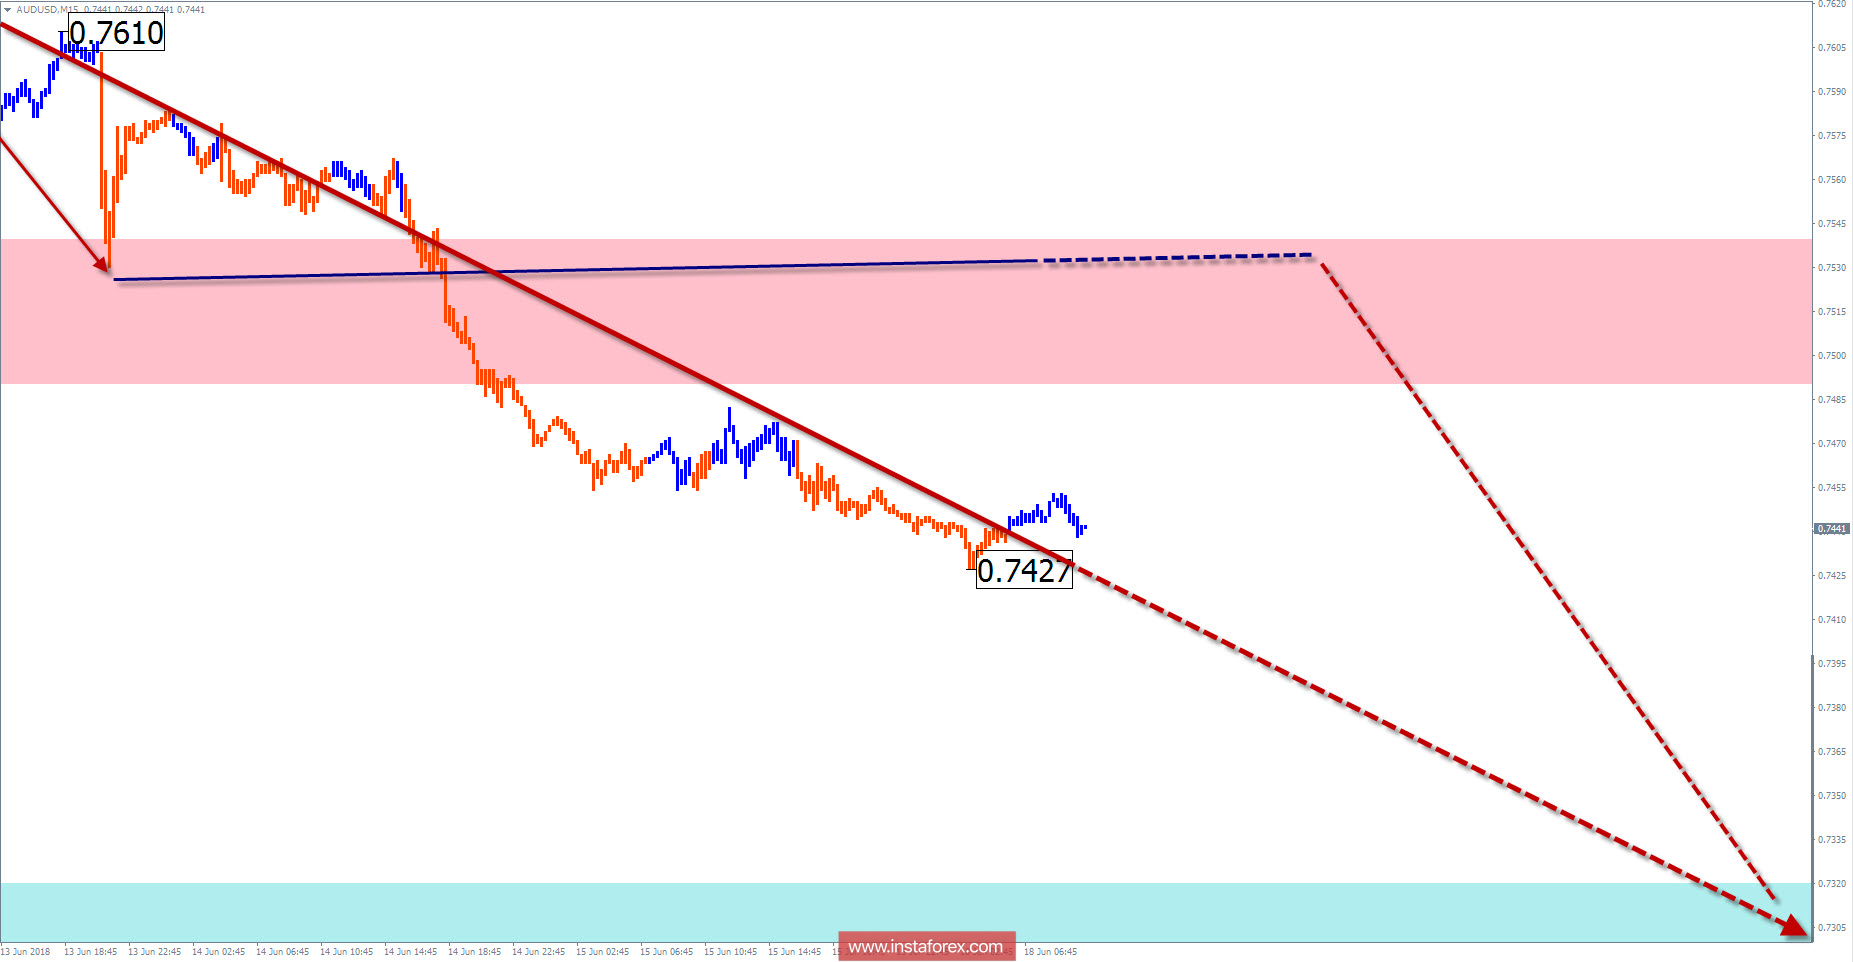
The wave pattern of the M15 chart:
Since June 6, the downward wave is developing. On a larger scale, it begins to form the final part (C) of the main trend. In the coming days, the price is expected to roll back up.
Recommended trading strategy:
Traders who are trading in higher timeframes before buying should wait for the completion of the current bearish wave. On a smaller scale, trade is recommended for the sale of tools.
Resistance zones:
- 0.7490 / 0.7540
Support zones:
- 0.7320 / 0.7270
Explanations to the figures:
A simplified wave analysis uses a simple waveform, in the form of a 3-part zigzag (ABC). The last incomplete wave for every timeframe is analyzed. Zones show the calculated areas with the greatest probability of a turn.
Arrows indicate the counting of wave according to the technique used by the author. The solid background shows the generated structure and the dotted exhibits the expected wave motion.
Attention: The wave algorithm does not take into account the duration of the tool movements in time. To conduct a trade transaction, you need to confirm the signals used by your trading systems.
InstaForex analytical reviews will make you fully aware of market trends! Being an InstaForex client, you are provided with a large number of free services for efficient trading.

